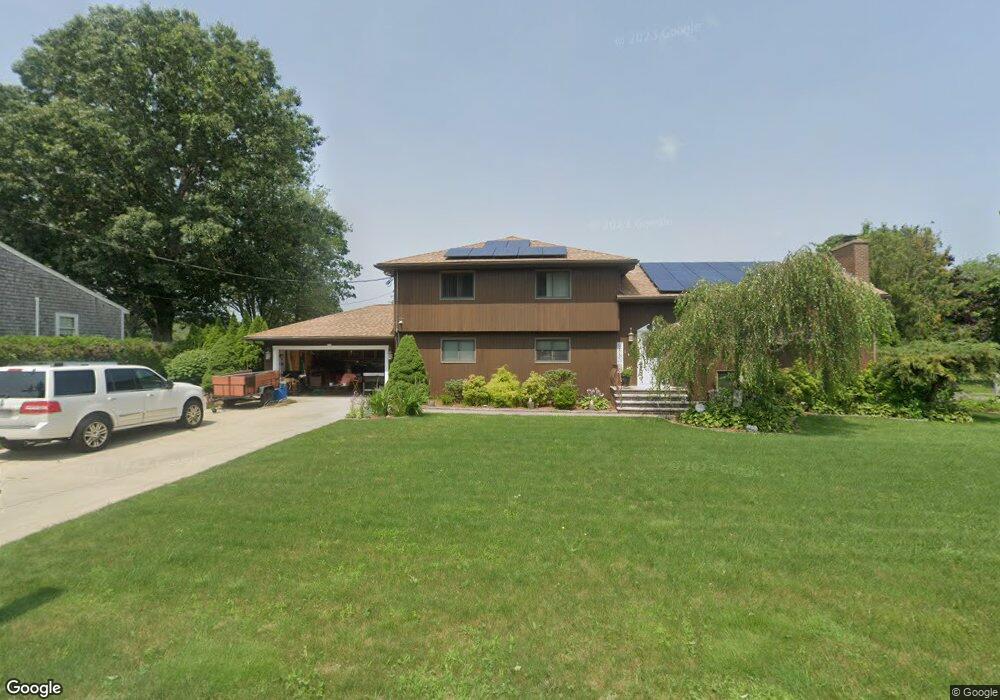
142 Sherman St South Dartmouth, MA 02748
Bliss Corner NeighborhoodEstimated Value: $469,809 - $517,000
3
Beds
1
Bath
1,196
Sq Ft
$415/Sq Ft
Est. Value
About This Home
This home is located at 142 Sherman St, South Dartmouth, MA 02748 and is currently estimated at $496,202, approximately $414 per square foot. 142 Sherman St is a home located in Bristol County with nearby schools including Dartmouth High School, St. Teresa of Calcutta School, and Our Sister's School.
Ownership History
Date
Name
Owned For
Owner Type
Purchase Details
Closed on
Nov 12, 2013
Sold by
Fhlmc
Bought by
Reis Gilberto F and Reis Lina M
Current Estimated Value
Purchase Details
Closed on
Mar 24, 1998
Sold by
Fontes Manuel A and Fontes Dorothy
Bought by
Misiaszek Curtis E and Misiaszek Melanie J
Purchase Details
Closed on
Jul 21, 1995
Sold by
Venda Nova Rt
Bought by
Fontes Manuel A and Fontes Dorothy
Create a Home Valuation Report for This Property
The Home Valuation Report is an in-depth analysis detailing your home's value as well as a comparison with similar homes in the area
Home Values in the Area
Average Home Value in this Area
Purchase History
| Date | Buyer | Sale Price | Title Company |
|---|---|---|---|
| Reis Gilberto F | $237,500 | -- | |
| Misiaszek Curtis E | $133,000 | -- | |
| Fontes Manuel A | $35,000 | -- |
Source: Public Records
Mortgage History
| Date | Status | Borrower | Loan Amount |
|---|---|---|---|
| Previous Owner | Fontes Manuel A | $270,000 | |
| Previous Owner | Fontes Manuel A | $78,000 | |
| Previous Owner | Fontes Manuel A | $172,000 | |
| Previous Owner | Fontes Manuel A | $25,000 |
Source: Public Records
Tax History Compared to Growth
Tax History
| Year | Tax Paid | Tax Assessment Tax Assessment Total Assessment is a certain percentage of the fair market value that is determined by local assessors to be the total taxable value of land and additions on the property. | Land | Improvement |
|---|---|---|---|---|
| 2025 | $3,472 | $403,300 | $120,500 | $282,800 |
| 2024 | $3,247 | $373,600 | $120,500 | $253,100 |
| 2023 | $3,135 | $341,900 | $120,500 | $221,400 |
| 2022 | $3,150 | $318,200 | $120,500 | $197,700 |
| 2021 | $3,062 | $295,600 | $117,000 | $178,600 |
| 2020 | $2,970 | $286,100 | $115,800 | $170,300 |
| 2019 | $2,822 | $271,300 | $111,100 | $160,200 |
| 2018 | $2,599 | $257,100 | $113,400 | $143,700 |
| 2017 | $2,507 | $250,200 | $104,800 | $145,400 |
| 2016 | $2,325 | $228,800 | $92,700 | $136,100 |
| 2015 | $2,273 | $224,200 | $86,600 | $137,600 |
| 2014 | $2,231 | $218,500 | $84,200 | $134,300 |
Source: Public Records
Map
Nearby Homes