1420 Allman St Oakland, CA 94602
Glenview NeighborhoodEstimated Value: $1,469,000 - $1,516,000
About This Home
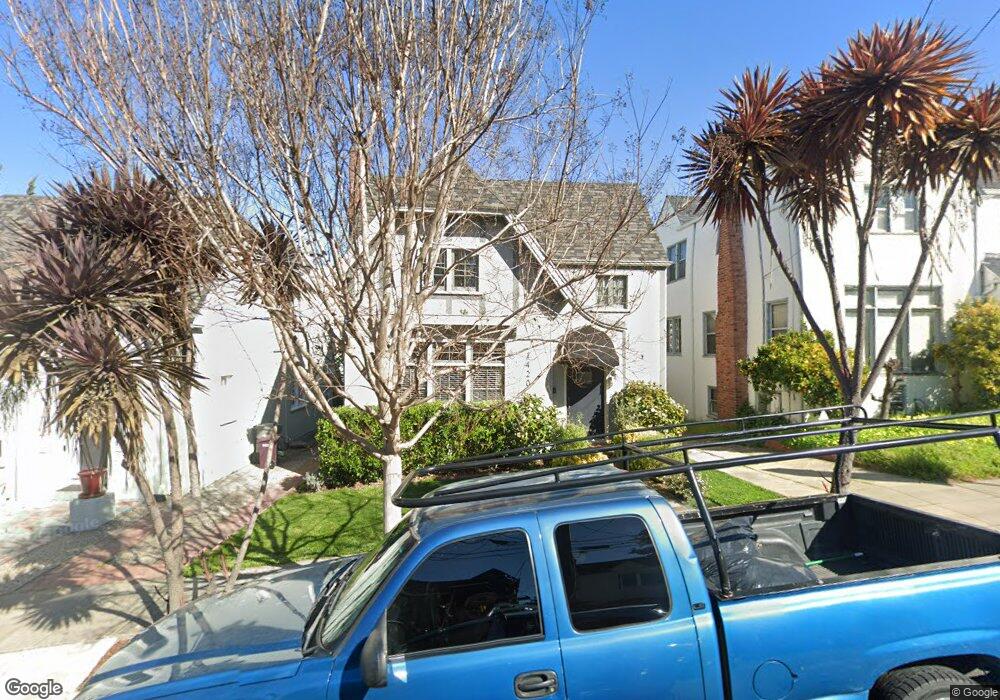
This home is located at 1420 Allman St, Oakland, CA 94602 and is currently estimated at $1,499,795, approximately $908 per square foot. 1420 Allman St is a home located in Alameda County with nearby schools including Glenview Elementary School, Edna Brewer Middle School, and Oakland High School.
Ownership History
We collect this data history from publicly available records. To have your information removed, we recommend requesting removal directly through your county’s website.
Purchase Details
Home Financials for this Owner
Home Financials are based on the most recent Mortgage that was taken out on this home.Purchase Details
Home Financials for this Owner
Home Financials are based on the most recent Mortgage that was taken out on this home.Purchase Details
Home Financials for this Owner
Home Financials are based on the most recent Mortgage that was taken out on this home.Purchase Details
Home Financials for this Owner
Home Financials are based on the most recent Mortgage that was taken out on this home.Purchase Details
Home Financials for this Owner
Home Financials are based on the most recent Mortgage that was taken out on this home.Purchase Details
Home Financials for this Owner
Home Financials are based on the most recent Mortgage that was taken out on this home.Home Values in the Area
Average Home Value in this Area
Purchase History
We collect this data history from publicly available records. To have your information removed, we recommend requesting removal directly through your county’s website.
| Date | Buyer | Sale Price | Title Company |
|---|---|---|---|
| $1,300,000 | Chicago Title Company | ||
| $975,000 | Chicago Title Company | ||
| -- | Old Republic Title Company | ||
| $630,000 | Old Republic Title Company | ||
| -- | Fidelity National Title Co | ||
| -- | Fidelity National Title Co |
Mortgage History
We collect this data history from publicly available records. To have your information removed, we recommend requesting removal directly through your county’s website.
| Date | Status | Borrower | Loan Amount |
|---|---|---|---|
| Open | $700,000 | ||
| Previous Owner | $625,500 | ||
| Previous Owner | $502,000 | ||
| Previous Owner | $504,000 | ||
| Previous Owner | $53,200 | ||
| Previous Owner | $53,200 |
Tax History
We collect this data history from publicly available records. To have your information removed, we recommend requesting removal directly through your county’s website.
| Year | Tax Paid | Tax Assessment Tax Assessment Total Assessment is a certain percentage of the fair market value that is determined by local assessors to be the total taxable value of land and additions on the property. | Land | Improvement |
|---|---|---|---|---|
| 2025 | $19,327 | $1,414,718 | $426,515 | $995,203 |
| 2024 | $19,327 | $1,386,846 | $418,154 | $975,692 |
| 2023 | $20,453 | $1,366,520 | $409,956 | $956,564 |
| 2022 | $20,020 | $1,332,727 | $401,918 | $937,809 |
| 2021 | $19,368 | $1,306,467 | $394,040 | $919,427 |
| 2020 | $19,160 | $1,300,000 | $390,000 | $910,000 |
| 2019 | $15,516 | $1,050,444 | $315,133 | $735,311 |
| 2018 | $15,190 | $1,029,853 | $308,956 | $720,897 |
| 2017 | $14,646 | $1,009,660 | $302,898 | $706,762 |
| 2016 | $14,257 | $989,868 | $296,960 | $692,908 |
| 2015 | $10,113 | $676,625 | $202,987 | $473,638 |
| 2014 | $10,282 | $663,377 | $199,013 | $464,364 |
Map
- 1458 E 33rd St
- 4037 Park Blvd
- 4035 Park Blvd
- 3608 Kingsley St
- 3104 14th Ave
- 1415 Hampel St
- 2220 E 31st St
- 1424 Hampel St
- 1134 Chatham Rd
- 4024 Elston Ave
- 3214 13th Ave
- 1112 E 33rd St
- 1515 Hampel St
- 1141 E 33rd St
- 976 Grosvenor Place
- 1930 E 30th St
- 1000 E 33rd St
- 1066 Bayview Ave
- 1085 Brookwood Rd
- 2821 Vallecito Place
- 1415 Allman St
- 1407 Allman St
- 1421 Allman St
- 1427 Allman St
- 1405 Allman St
- 1450 Excelsior Ave
- 1433 Allman St
- 1456 Excelsior Ave
- 1442 Excelsior Ave
- 1397 Allman St
- 1414 Allman St
- 1460 Excelsior Ave
- 1406 Allman St
- 1426 Allman St
- 1439 Allman St
- 1400 Allman St
- 1436 Excelsior Ave
- 1464 Excelsior Ave
- 1442 Allman St
- 1398 Allman St
Ask me questions while you tour the home.