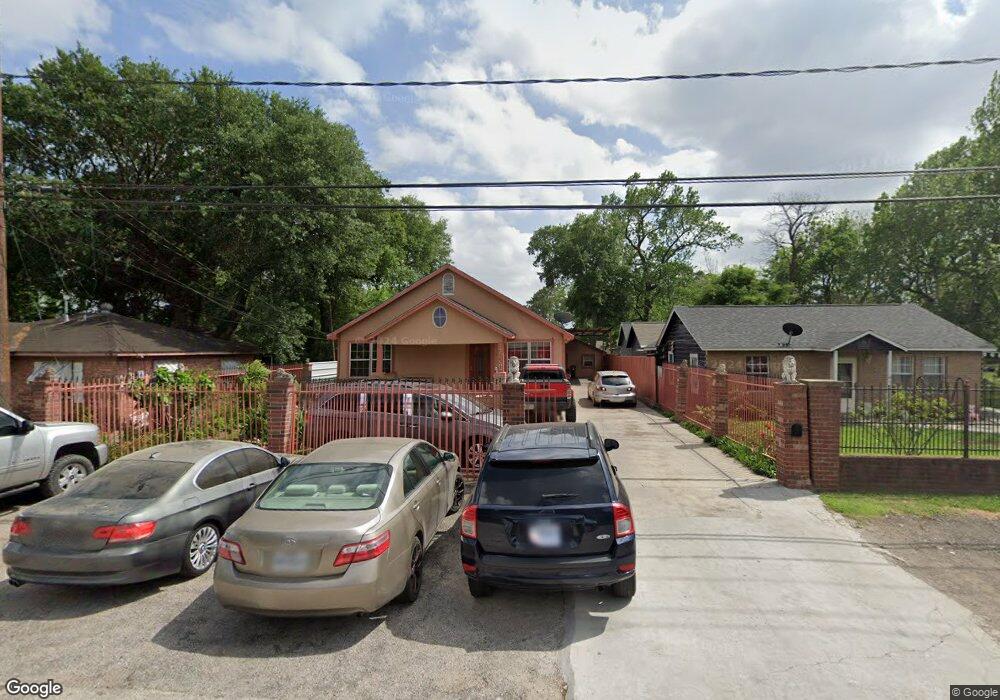
1420 De Boll St Houston, TX 77022
Northside-Northline NeighborhoodEstimated Value: $254,795 - $310,000
3
Beds
2
Baths
2,136
Sq Ft
$135/Sq Ft
Est. Value
About This Home
This home is located at 1420 De Boll St, Houston, TX 77022 and is currently estimated at $287,699, approximately $134 per square foot. 1420 De Boll St is a home located in Harris County with nearby schools including Burbank Elementary School, Burbank Middle School, and Sam Houston Math, Science & Technology Center.
Ownership History
Date
Name
Owned For
Owner Type
Purchase Details
Closed on
Oct 25, 2006
Sold by
Soto Guadalupe
Bought by
Salas Sandro Leyva and Fuentes Elida Fabiola
Current Estimated Value
Home Financials for this Owner
Home Financials are based on the most recent Mortgage that was taken out on this home.
Original Mortgage
$89,000
Interest Rate
6.37%
Mortgage Type
Seller Take Back
Purchase Details
Closed on
Mar 30, 1998
Sold by
Morgan Lois and Worsham Naomi
Bought by
Soto Guadalupe
Create a Home Valuation Report for This Property
The Home Valuation Report is an in-depth analysis detailing your home's value as well as a comparison with similar homes in the area
Home Values in the Area
Average Home Value in this Area
Purchase History
| Date | Buyer | Sale Price | Title Company |
|---|---|---|---|
| Salas Sandro Leyva | -- | None Available | |
| Soto Guadalupe | -- | -- |
Source: Public Records
Mortgage History
| Date | Status | Borrower | Loan Amount |
|---|---|---|---|
| Closed | Salas Sandro Leyva | $89,000 |
Source: Public Records
Tax History Compared to Growth
Tax History
| Year | Tax Paid | Tax Assessment Tax Assessment Total Assessment is a certain percentage of the fair market value that is determined by local assessors to be the total taxable value of land and additions on the property. | Land | Improvement |
|---|---|---|---|---|
| 2025 | $4,508 | $226,162 | $102,600 | $123,562 |
| 2024 | $4,508 | $215,464 | $94,163 | $121,301 |
| 2023 | $4,508 | $248,087 | $57,375 | $190,712 |
| 2022 | $4,527 | $205,597 | $57,375 | $148,222 |
| 2021 | $3,840 | $164,760 | $57,375 | $107,385 |
| 2020 | $3,644 | $150,499 | $57,375 | $93,124 |
| 2019 | $3,694 | $145,990 | $47,250 | $98,740 |
| 2018 | $2,938 | $116,091 | $39,488 | $76,603 |
| 2017 | $2,935 | $116,091 | $39,488 | $76,603 |
| 2016 | $1,852 | $75,531 | $37,125 | $38,406 |
| 2015 | $1,197 | $66,569 | $27,000 | $39,569 |
| 2014 | $1,197 | $66,569 | $27,000 | $39,569 |
Source: Public Records
Map
Nearby Homes
- 1207 Firnat St
- 807 Firnat St
- 723 Doverside St
- 1104 Charnwood St
- 702 Pennington St
- 8109 W Hardy Rd
- 9026 Mcgallion Rd
- 8411 Berry Brush Ln
- 8402 Berry Green Ln
- 8718 Brannon St
- 802 Berry Sage Ln
- 743 Apache St
- 1016 Apache St
- 9650 E Hardy Rd
- 88 Berry Rd
- 9021 Lomax St
- 631 Apache St
- 714 Apache St
- 9630 Burden St
- 9634 Burden St
- 1416 De Boll St
- 1422 De Boll St
- 9000 W Hardy Rd
- 1408 De Boll St
- 9013 W Hardy Rd
- 1411 Firnat St
- 9101 W Hardy Rd
- 1407 Firnat St
- 1403 Firnat St
- 1404 De Boll St
- 9001 W Hardy Rd
- 1321 Firnat St
- 1413 De Boll St
- 9111 W Hardy Rd
- 1326 De Boll St
- 1411 De Boll St
- 1319 Firnat St
- 1409 De Boll St
- 1324 De Boll St
- 1317 Firnat St