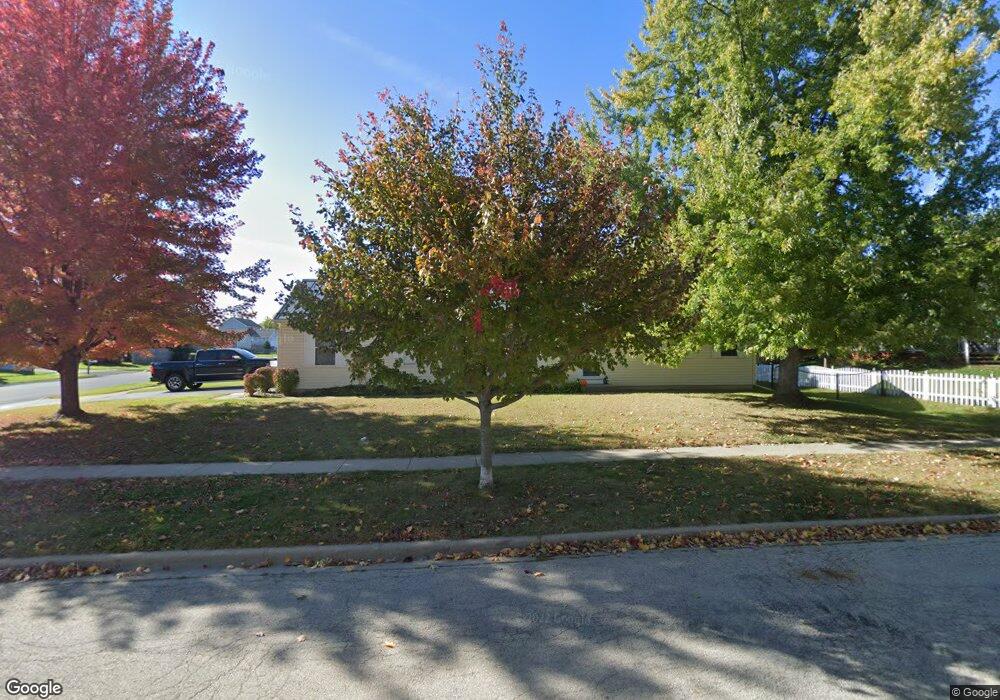
1420 Ginny Ln Woodstock, IL 60098
Estimated Value: $243,000 - $295,000
2
Beds
2
Baths
1,008
Sq Ft
$273/Sq Ft
Est. Value
About This Home
This home is located at 1420 Ginny Ln, Woodstock, IL 60098 and is currently estimated at $275,413, approximately $273 per square foot. 1420 Ginny Ln is a home located in McHenry County with nearby schools including Dean Street Elementary School, Creekside Middle School, and Woodstock High School.
Ownership History
Date
Name
Owned For
Owner Type
Purchase Details
Closed on
Dec 20, 1999
Sold by
Butenschoen William C and Butenschoen Kerrie L
Bought by
Mishler Brian T
Current Estimated Value
Home Financials for this Owner
Home Financials are based on the most recent Mortgage that was taken out on this home.
Original Mortgage
$109,800
Outstanding Balance
$34,399
Interest Rate
7.87%
Estimated Equity
$241,014
Purchase Details
Closed on
Aug 31, 1999
Sold by
Reschke Michael R and Reschke Lorna K
Bought by
Butenschoen William C and Butenschoen Kerrie L
Home Financials for this Owner
Home Financials are based on the most recent Mortgage that was taken out on this home.
Original Mortgage
$88,380
Interest Rate
7.59%
Purchase Details
Closed on
Nov 5, 1998
Sold by
Amcore Trust Company
Bought by
Reschke Michael R and Reschke Lorna K
Home Financials for this Owner
Home Financials are based on the most recent Mortgage that was taken out on this home.
Original Mortgage
$123,990
Interest Rate
6.72%
Mortgage Type
Construction
Create a Home Valuation Report for This Property
The Home Valuation Report is an in-depth analysis detailing your home's value as well as a comparison with similar homes in the area
Home Values in the Area
Average Home Value in this Area
Purchase History
| Date | Buyer | Sale Price | Title Company |
|---|---|---|---|
| Mishler Brian T | $122,000 | Chicago Title | |
| Butenschoen William C | -- | -- | |
| Reschke Michael R | $35,000 | Chicago Title |
Source: Public Records
Mortgage History
| Date | Status | Borrower | Loan Amount |
|---|---|---|---|
| Open | Mishler Brian T | $109,800 | |
| Previous Owner | Butenschoen William C | $88,380 | |
| Previous Owner | Reschke Michael R | $123,990 |
Source: Public Records
Tax History Compared to Growth
Tax History
| Year | Tax Paid | Tax Assessment Tax Assessment Total Assessment is a certain percentage of the fair market value that is determined by local assessors to be the total taxable value of land and additions on the property. | Land | Improvement |
|---|---|---|---|---|
| 2024 | $5,707 | $72,442 | $12,605 | $59,837 |
| 2023 | $5,381 | $65,511 | $11,399 | $54,112 |
| 2022 | $5,118 | $58,139 | $10,116 | $48,023 |
| 2021 | $4,836 | $54,321 | $9,452 | $44,869 |
| 2020 | $4,889 | $54,002 | $8,981 | $45,021 |
| 2019 | $4,723 | $51,548 | $8,573 | $42,975 |
| 2018 | $4,323 | $47,282 | $9,780 | $37,502 |
| 2017 | $4,428 | $46,359 | $9,205 | $37,154 |
| 2016 | $4,345 | $42,925 | $8,523 | $34,402 |
| 2013 | -- | $32,431 | $6,979 | $25,452 |
Source: Public Records
Map
Nearby Homes
- 1380 Sandpiper Ln
- 1500 Sandpiper Ln
- 301 Clover Chase Cir Unit 5
- 2007 Edgewood Dr
- 155 Lee Ann Ln
- 331 Chestnut St
- 321 Hoy Ave
- 421 W Kimball Ave
- 104 Stewart Ave
- 434 Lake Ave
- 125 Forest Ave
- 415 Dean St
- 999 Eastwood Dr
- 330 Lake Ave
- 9999 E Calhoun St
- 2681 Braeburn Way
- 501 Leah Ln Unit 2C
- 377 Fieldstone Dr
- 324 Fieldstone Dr
- 1249 Prairie Ridge Trail
- 571 Prairie Ridge Dr
- 1388 Wood Dr
- 1380 Wood Dr
- 561 Prairie Ridge Dr
- 1421 Ginny Ln Unit 1
- 1411 Ginny Ln
- 580 Prairie Ridge Dr
- 570 Prairie Ridge Dr
- 1372 Wood Dr
- 551 Prairie Ridge Dr
- 1401 Ginny Ln Unit 1
- 1501 Ginny Ln
- 1501 Acacia Ln
- 1364 Wood Dr
- 1510 Ginny Ln
- 541 Prairie Ridge Dr
- 1420 Sandpiper Ln
- 1331 Ginny Ln
- 1410 Sandpiper Ln
- 1511 Ginny Ln Unit 2