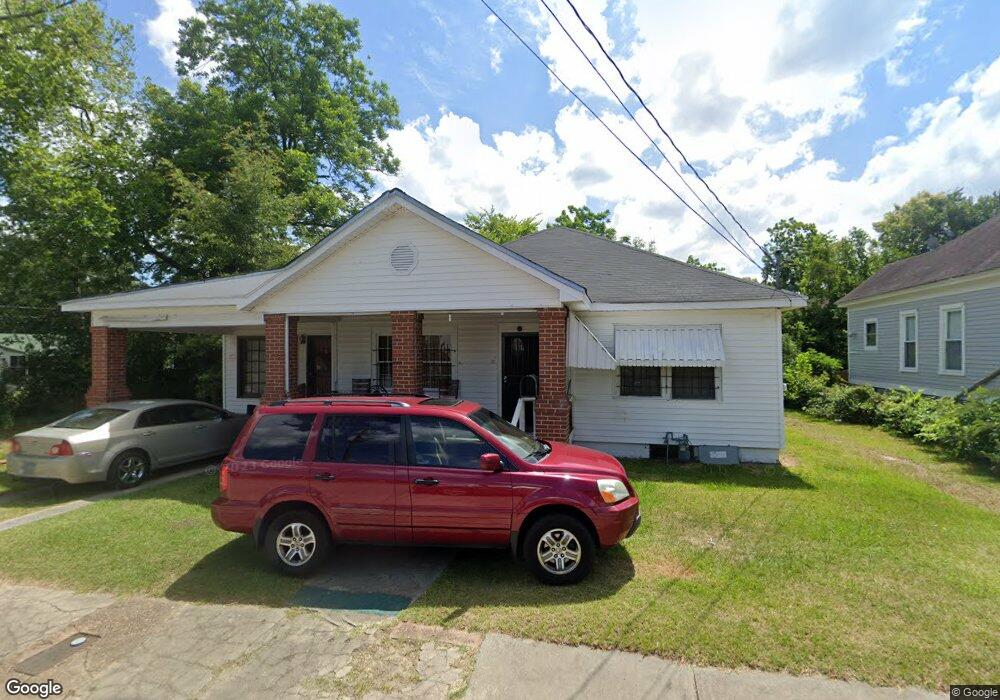
1420 Oakland Ave Macon, GA 31204
Napier Heights Historic District NeighborhoodEstimated Value: $85,000 - $132,000
3
Beds
2
Baths
1,658
Sq Ft
$63/Sq Ft
Est. Value
About This Home
This home is located at 1420 Oakland Ave, Macon, GA 31204 and is currently estimated at $103,873, approximately $62 per square foot. 1420 Oakland Ave is a home located in Bibb County with nearby schools including Hartley Elementary School, Southwest High School, and Cirrus Charter Academy.
Ownership History
Date
Name
Owned For
Owner Type
Purchase Details
Closed on
Jun 23, 2022
Sold by
Chikofte Llc
Bought by
Macon Om Portfolio Llc
Current Estimated Value
Home Financials for this Owner
Home Financials are based on the most recent Mortgage that was taken out on this home.
Original Mortgage
$57,000
Interest Rate
5.1%
Mortgage Type
Construction
Purchase Details
Closed on
Feb 20, 2020
Sold by
Mq Properties Llc
Bought by
Chikofte Llc
Purchase Details
Closed on
Feb 18, 2020
Sold by
Deckbar Donald C and Deckbar Elaine G
Bought by
The Max Properties Llc
Purchase Details
Closed on
Jan 21, 2005
Sold by
Deutsch Bank National Trust Co
Bought by
Deckbar Donald C and Deckbar Elaine G
Purchase Details
Closed on
Nov 2, 2004
Purchase Details
Closed on
Dec 10, 2003
Purchase Details
Closed on
Jun 18, 2003
Purchase Details
Closed on
Jan 30, 1996
Create a Home Valuation Report for This Property
The Home Valuation Report is an in-depth analysis detailing your home's value as well as a comparison with similar homes in the area
Home Values in the Area
Average Home Value in this Area
Purchase History
| Date | Buyer | Sale Price | Title Company |
|---|---|---|---|
| Macon Om Portfolio Llc | $60,800 | None Listed On Document | |
| Chikofte Llc | $108,873 | None Available | |
| Mq Properties Llc | $240,000 | None Available | |
| The Max Properties Llc | $58,334 | None Available | |
| Deckbar Donald C | $41,000 | -- | |
| -- | $35,000 | -- | |
| -- | $66,000 | -- | |
| -- | $20,000 | -- | |
| -- | -- | -- |
Source: Public Records
Mortgage History
| Date | Status | Borrower | Loan Amount |
|---|---|---|---|
| Closed | Macon Om Portfolio Llc | $57,000 |
Source: Public Records
Tax History Compared to Growth
Tax History
| Year | Tax Paid | Tax Assessment Tax Assessment Total Assessment is a certain percentage of the fair market value that is determined by local assessors to be the total taxable value of land and additions on the property. | Land | Improvement |
|---|---|---|---|---|
| 2025 | $1,228 | $49,991 | $1,980 | $48,011 |
| 2024 | $1,270 | $49,991 | $1,980 | $48,011 |
| 2023 | $1,154 | $45,446 | $1,800 | $43,646 |
| 2022 | $541 | $15,624 | $2,114 | $13,510 |
| 2021 | $436 | $11,484 | $2,014 | $9,470 |
| 2020 | $441 | $11,371 | $2,014 | $9,357 |
| 2019 | $445 | $11,371 | $2,014 | $9,357 |
| 2018 | $862 | $11,371 | $2,014 | $9,357 |
| 2017 | $426 | $11,371 | $2,014 | $9,357 |
| 2016 | $393 | $11,370 | $2,014 | $9,357 |
| 2015 | $759 | $15,496 | $3,020 | $12,476 |
| 2014 | $873 | $15,496 | $3,020 | $12,476 |
Source: Public Records
Map
Nearby Homes
- 1446 Marion Place
- 1159 Huguenin Ave
- 1181 Hendley St
- 1495 Ninadel Dr
- 2334 Napier Ave
- 2079 E Napier Ave
- 2485 Beech Ave
- 1195 Lawton Dr
- 2435 Napier Ave
- 2497 Napier Ave
- 1687 Lawton Ave
- 1661 Lawton Ave
- 2534 Napier Ave
- 1285 Pio Nono Ave
- 1518 Marigold Ave
- 1340 Courtland Ave
- 1568 Marigold Ave
- 1119 Adams St
- 1580 Marigold Ave
- 2686 Napier Ave
- 1412 Oakland Ave
- 1428 Oakland Ave
- 2044 Montpelier Ave
- 2074 Montpelier Ave
- 1434 Oakland Ave
- 2032 Montpelier Ave
- 1419 Marion Place
- 1427 Marion Place
- 1437 Marion Place
- 2014 Montpelier Ave
- 1442 Oakland Ave
- 1427 Oakland Ave
- 1445 Marion Place
- 1445 Marion Place Unit 25-2E
- 1435 Oakland Ave
- 1443 Oakland Ave
- 1455 Marion Place
- 2063 Montpelier Ave
- 0 Marion Place
- 2081 Montpelier Ave