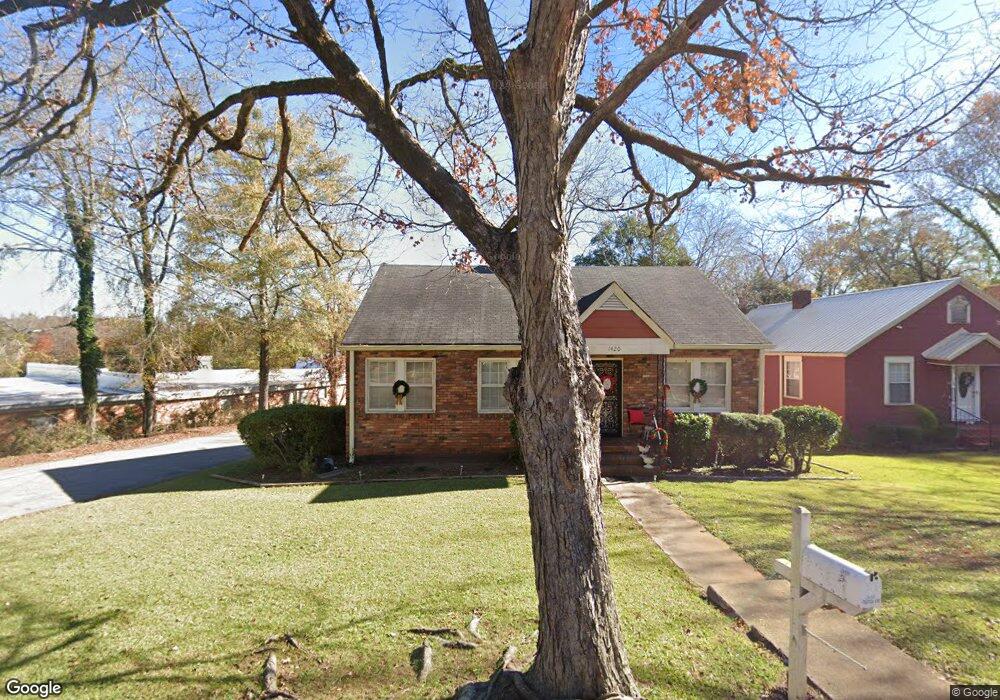
1420 Roper Ave West Point, GA 31833
Estimated Value: $68,000 - $177,000
4
Beds
2
Baths
1,894
Sq Ft
$74/Sq Ft
Est. Value
About This Home
This home is located at 1420 Roper Ave, West Point, GA 31833 and is currently estimated at $140,775, approximately $74 per square foot. 1420 Roper Ave is a home with nearby schools including West Point Elementary School, Long Cane Elementary School, and Whitesville Road Elementary School.
Ownership History
Date
Name
Owned For
Owner Type
Purchase Details
Closed on
May 21, 2025
Sold by
Mk Property Management Group Llc
Bought by
Barrett Nisa
Current Estimated Value
Home Financials for this Owner
Home Financials are based on the most recent Mortgage that was taken out on this home.
Original Mortgage
$69,000
Outstanding Balance
$62,104
Interest Rate
6.81%
Mortgage Type
New Conventional
Estimated Equity
$78,671
Purchase Details
Closed on
Apr 1, 2025
Sold by
Barrett Nisa
Bought by
Mk Property Management Group Llc
Home Financials for this Owner
Home Financials are based on the most recent Mortgage that was taken out on this home.
Original Mortgage
$69,000
Outstanding Balance
$62,104
Interest Rate
6.81%
Mortgage Type
New Conventional
Estimated Equity
$78,671
Purchase Details
Closed on
Jan 31, 2023
Sold by
Mk Property Management Grp Llc
Bought by
Smith Juland and Barrett Nisa
Home Financials for this Owner
Home Financials are based on the most recent Mortgage that was taken out on this home.
Original Mortgage
$61,253
Interest Rate
6.48%
Mortgage Type
New Conventional
Purchase Details
Closed on
Jun 14, 2002
Sold by
Ellen Y Price
Bought by
Earl Maxie G
Purchase Details
Closed on
Feb 11, 1996
Sold by
W A Price Trust
Bought by
Ellen Y Price
Purchase Details
Closed on
May 1, 1988
Sold by
Price Jr Et-Al W A
Bought by
W A Price Trust
Purchase Details
Closed on
Oct 1, 1940
Sold by
Mrs Lillian E Green
Bought by
Price W A
Create a Home Valuation Report for This Property
The Home Valuation Report is an in-depth analysis detailing your home's value as well as a comparison with similar homes in the area
Home Values in the Area
Average Home Value in this Area
Purchase History
| Date | Buyer | Sale Price | Title Company |
|---|---|---|---|
| Barrett Nisa | $63,686 | -- | |
| Mk Property Management Group Llc | $63,661 | -- | |
| Smith Juland | $155,000 | -- | |
| Earl Maxie G | $240,000 | -- | |
| Ellen Y Price | $48,000 | -- | |
| W A Price Trust | $30,000 | -- | |
| Price Jr Et-Al W A | $30,000 | -- | |
| Price W A | -- | -- |
Source: Public Records
Mortgage History
| Date | Status | Borrower | Loan Amount |
|---|---|---|---|
| Open | Barrett Nisa | $69,000 | |
| Previous Owner | Smith Juland | $61,253 |
Source: Public Records
Tax History
| Year | Tax Paid | Tax Assessment Tax Assessment Total Assessment is a certain percentage of the fair market value that is determined by local assessors to be the total taxable value of land and additions on the property. | Land | Improvement |
|---|---|---|---|---|
| 2025 | $1,273 | $60,972 | $1,800 | $59,172 |
| 2024 | $1,273 | $58,372 | $1,800 | $56,572 |
| 2023 | $2,204 | $61,892 | $1,800 | $60,092 |
| 2022 | $1,055 | $37,812 | $1,800 | $36,012 |
| 2021 | $850 | $28,184 | $680 | $27,504 |
| 2020 | $850 | $28,184 | $680 | $27,504 |
| 2019 | $748 | $24,804 | $680 | $24,124 |
| 2018 | $715 | $23,700 | $712 | $22,988 |
| 2017 | $715 | $23,700 | $712 | $22,988 |
| 2016 | $691 | $22,914 | $712 | $22,202 |
| 2015 | $692 | $22,914 | $712 | $22,202 |
| 2014 | $658 | $21,746 | $712 | $21,034 |
| 2013 | -- | $23,398 | $712 | $22,686 |
Source: Public Records
Map
Nearby Homes
- 1314 4th Ave
- 1007 4th Ave
- 1508 N 4th Ave
- 210 N 14th St
- 712 4th Ave
- 1026 N 6th Ave
- 1903 Ridgewood Dr
- 1800 Malco Dr
- 1202 E 9th St
- 713 Avenue H
- 311 E 4th St
- 508 Pine St
- 811 Cherry Dr
- 514 N 8th Ave
- 0 Ga Highway 0116 Unit 10619139
- 1104 E 8th St
- 0 Arrowhead Dr Unit 10451860
- 1105 E 7th St
- 509 Cleveland St
- 0 Sunset Dr Unit 10451831
Your Personal Tour Guide
Ask me questions while you tour the home.