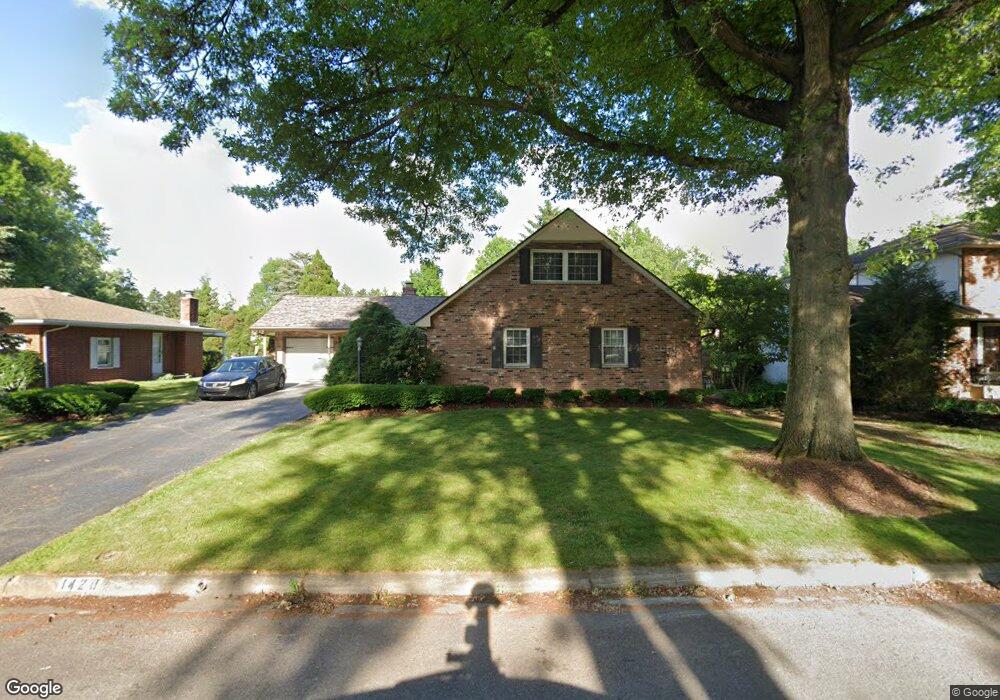
1420 Walshire Dr N Columbus, OH 43232
Shady Lane NeighborhoodEstimated Value: $321,823 - $370,000
5
Beds
3
Baths
2,348
Sq Ft
$144/Sq Ft
Est. Value
About This Home
This home is located at 1420 Walshire Dr N, Columbus, OH 43232 and is currently estimated at $338,456, approximately $144 per square foot. 1420 Walshire Dr N is a home located in Franklin County with nearby schools including Woodcrest Elementary School, Sherwood Middle School, and Walnut Ridge High School.
Ownership History
Date
Name
Owned For
Owner Type
Purchase Details
Closed on
Oct 15, 2015
Sold by
Dickerson S J
Bought by
Dickerson Mark
Current Estimated Value
Purchase Details
Closed on
Jul 22, 2003
Sold by
Corry James A and Jackson Lisa A
Bought by
Dickerson S J
Home Financials for this Owner
Home Financials are based on the most recent Mortgage that was taken out on this home.
Original Mortgage
$132,750
Outstanding Balance
$56,651
Interest Rate
5.31%
Mortgage Type
Purchase Money Mortgage
Estimated Equity
$281,805
Purchase Details
Closed on
May 5, 2000
Sold by
Low Edward M and Low Dorothy K
Bought by
Corry James A and Corry Lisa A
Home Financials for this Owner
Home Financials are based on the most recent Mortgage that was taken out on this home.
Original Mortgage
$144,821
Interest Rate
8.24%
Mortgage Type
FHA
Purchase Details
Closed on
Jul 26, 1984
Bought by
Low Edward M
Purchase Details
Closed on
Jul 1, 1977
Create a Home Valuation Report for This Property
The Home Valuation Report is an in-depth analysis detailing your home's value as well as a comparison with similar homes in the area
Home Values in the Area
Average Home Value in this Area
Purchase History
| Date | Buyer | Sale Price | Title Company |
|---|---|---|---|
| Dickerson Mark | -- | None Available | |
| Dickerson S J | $147,500 | Columbus Title Agency Inc | |
| Corry James A | $144,900 | Esquire Title | |
| Low Edward M | $75,000 | -- | |
| -- | $58,000 | -- |
Source: Public Records
Mortgage History
| Date | Status | Borrower | Loan Amount |
|---|---|---|---|
| Open | Dickerson S J | $132,750 | |
| Previous Owner | Corry James A | $144,821 |
Source: Public Records
Tax History Compared to Growth
Tax History
| Year | Tax Paid | Tax Assessment Tax Assessment Total Assessment is a certain percentage of the fair market value that is determined by local assessors to be the total taxable value of land and additions on the property. | Land | Improvement |
|---|---|---|---|---|
| 2024 | $4,356 | $97,060 | $16,380 | $80,680 |
| 2023 | $4,300 | $97,055 | $16,380 | $80,675 |
| 2022 | $3,313 | $63,880 | $7,630 | $56,250 |
| 2021 | $3,319 | $63,880 | $7,630 | $56,250 |
| 2020 | $3,323 | $63,880 | $7,630 | $56,250 |
| 2019 | $3,075 | $50,690 | $6,130 | $44,560 |
| 2018 | $2,892 | $50,690 | $6,130 | $44,560 |
| 2017 | $3,073 | $50,690 | $6,130 | $44,560 |
| 2016 | $2,992 | $45,160 | $7,670 | $37,490 |
| 2015 | $2,716 | $45,160 | $7,670 | $37,490 |
| 2014 | $2,800 | $45,160 | $7,670 | $37,490 |
| 2013 | $1,534 | $50,155 | $8,505 | $41,650 |
Source: Public Records
Map
Nearby Homes
- 5366 Yorkshire Village Ln Unit B-22
- 1718 Sunapple Way
- 5789 Riverton Rd
- 1591 Stephanie Ct Unit 15912
- 1616 Coppertree Rd Unit 1615
- 5596 Autumn Chase Dr
- 1314 Yorkland Rd Unit C
- 1759 Lonsdale Rd
- 5337 Ivyhurst Dr
- 1859 Woodette Rd
- 1942 Bairsford Dr Unit 944
- 1930 Walnut Hill Park Dr
- 6004 Radekin Rd
- 1486 Efner Dr
- 5194 Orlando Ct
- 1320 Nancy Ln
- 1120 Fairway Blvd
- 5036 Brinwood Place
- 0 Radekin Rd Unit 225029852
- 6156 Roselawn Ave
- 1412 Walshire Dr N
- 1432 Walshire Dr N
- 1437 Knollwood Dr E
- 1445 Knollwood Dr E
- 1425 Knollwood Dr E
- 1400 Walshire Dr N
- 1444 Walshire Dr N
- 1415 Walshire Dr N
- 1427 Walshire Dr N
- 1451 Knollwood Dr E
- 1407 Walshire Dr N
- 1417 Knollwood Dr E
- 1439 Walshire Dr N
- 1392 Walshire Dr N
- 1395 Walshire Dr N
- 1463 Knollwood Dr E
- 1405 Knollwood Dr E
- 1475 Knollwood Dr E
- 1447 Walshire Dr N
- 1458 Walshire Dr N