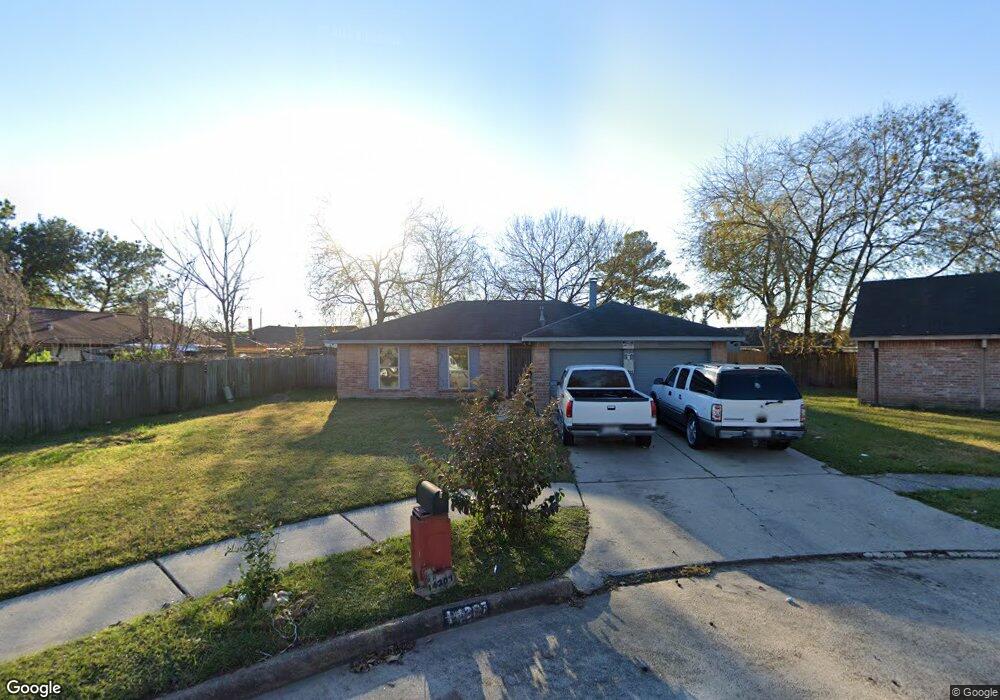
14207 Cluster Pines Ct Houston, TX 77066
Champions NeighborhoodEstimated Value: $188,000 - $197,000
3
Beds
2
Baths
1,248
Sq Ft
$154/Sq Ft
Est. Value
About This Home
This home is located at 14207 Cluster Pines Ct, Houston, TX 77066 and is currently estimated at $192,567, approximately $154 per square foot. 14207 Cluster Pines Ct is a home located in Harris County with nearby schools including Griggs EC/PK/K, Conley Elementary School, and Plummer Middle School.
Ownership History
Date
Name
Owned For
Owner Type
Purchase Details
Closed on
Jan 16, 2002
Sold by
Muniz Rosa I and Muniz Adolfo
Bought by
Romo Jose
Current Estimated Value
Home Financials for this Owner
Home Financials are based on the most recent Mortgage that was taken out on this home.
Original Mortgage
$79,055
Outstanding Balance
$31,753
Interest Rate
6.8%
Estimated Equity
$160,814
Purchase Details
Closed on
Mar 23, 2000
Sold by
Nguyen Ty Thai
Bought by
Tran Thi Duyen and Nguyen Vuong Hoang
Purchase Details
Closed on
Aug 17, 1995
Sold by
Melonson Patrick Neal and Melonson Cynthia Sonya
Bought by
Rios Rosa I
Home Financials for this Owner
Home Financials are based on the most recent Mortgage that was taken out on this home.
Original Mortgage
$47,000
Interest Rate
7.39%
Create a Home Valuation Report for This Property
The Home Valuation Report is an in-depth analysis detailing your home's value as well as a comparison with similar homes in the area
Home Values in the Area
Average Home Value in this Area
Purchase History
| Date | Buyer | Sale Price | Title Company |
|---|---|---|---|
| Romo Jose | -- | Commonwealth Land Title | |
| Tran Thi Duyen | -- | -- | |
| Rios Rosa I | -- | Fidelity National Title |
Source: Public Records
Mortgage History
| Date | Status | Borrower | Loan Amount |
|---|---|---|---|
| Open | Romo Jose | $79,055 | |
| Previous Owner | Rios Rosa I | $47,000 |
Source: Public Records
Tax History Compared to Growth
Tax History
| Year | Tax Paid | Tax Assessment Tax Assessment Total Assessment is a certain percentage of the fair market value that is determined by local assessors to be the total taxable value of land and additions on the property. | Land | Improvement |
|---|---|---|---|---|
| 2025 | $2,124 | $179,608 | $39,414 | $140,194 |
| 2024 | $2,124 | $184,584 | $39,414 | $145,170 |
| 2023 | $2,124 | $204,669 | $39,414 | $165,255 |
| 2022 | $3,078 | $174,654 | $25,931 | $148,723 |
| 2021 | $2,966 | $145,809 | $25,931 | $119,878 |
| 2020 | $2,932 | $132,629 | $25,931 | $106,698 |
| 2019 | $2,776 | $111,845 | $13,830 | $98,015 |
| 2018 | $778 | $100,464 | $13,830 | $86,634 |
| 2017 | $2,228 | $100,464 | $13,830 | $86,634 |
| 2016 | $2,025 | $100,464 | $13,830 | $86,634 |
| 2015 | $1,336 | $88,752 | $13,830 | $74,922 |
| 2014 | $1,336 | $62,604 | $13,830 | $48,774 |
Source: Public Records
Map
Nearby Homes
- 14207 Timberhaven Dr
- 3407 Sandbrook Dr
- 14118 Magnolia Springs Dr
- 11322 Yorklyn Dr
- 3519 Hombly Rd
- 14003 Valley Grove Dr
- 3230 Hombly Rd
- 11335 Chelsea Walk Dr
- 11427 Valarno Dr
- 3240 Brownie Campbell Rd
- 3446 Cheaney Dr
- 13610 Kaltenbrun Rd
- 13803 Bearwood Rd
- 2606 Owens Cross Dr
- 11009 Panicum Ct
- 2919 Sunwood Dr
- 6610 Northleaf Dr
- 11021 Crenchrus Ct
- 13518 Kaltenbrun Rd
- 12207 Mckamy Dr
- 3466 Sandbrook Dr
- 14211 Cluster Pines Ct
- 3462 Sandbrook Dr
- 3470 Sandbrook Dr
- 14214 Timberhaven Dr
- 14218 Timberhaven Dr
- 14214 Cluster Pines Ct
- 14222 Timberhaben
- 3474 Sandbrook Dr
- 14222 Timberhaven Dr
- 3450 Sandbrook Dr
- 14210 Cluster Pines Ct
- 14206 Cluster Pines Ct
- 14226 Timberhaven Dr
- 3442 Sandbrook Dr
- 3467 Sandbrook Dr
- 3463 Sandbrook Dr
- 3459 Sandbrook Dr
- 3471 Sandbrook Dr
- 3423 Pinechester Dr