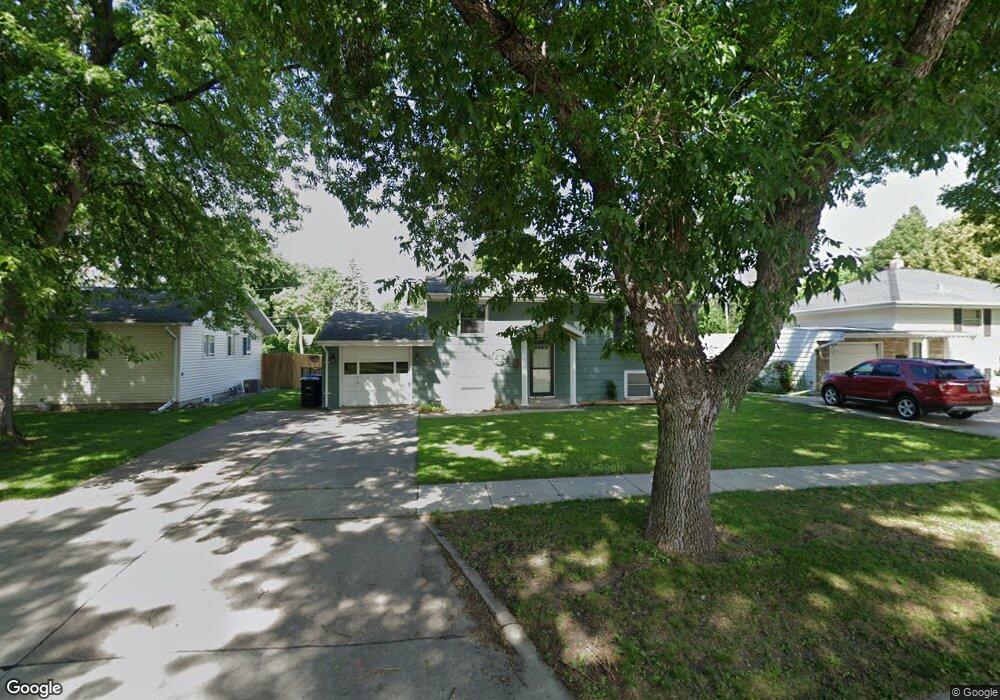
1421 18th St S Fargo, ND 58103
South High NeighborhoodEstimated Value: $256,000 - $275,000
4
Beds
2
Baths
1,768
Sq Ft
$151/Sq Ft
Est. Value
About This Home
This home is located at 1421 18th St S, Fargo, ND 58103 and is currently estimated at $267,197, approximately $151 per square foot. 1421 18th St S is a home located in Cass County with nearby schools including Lewis & Clark Elementary School, Carl Ben Eielson Middle School, and South High School.
Ownership History
Date
Name
Owned For
Owner Type
Purchase Details
Closed on
Jul 13, 2017
Sold by
Dreger Thomas C and Coyle Connie S
Bought by
Anderson John W and Sand Anderson Jessica J
Current Estimated Value
Home Financials for this Owner
Home Financials are based on the most recent Mortgage that was taken out on this home.
Original Mortgage
$153,174
Outstanding Balance
$128,332
Interest Rate
4.2%
Mortgage Type
FHA
Estimated Equity
$138,865
Purchase Details
Closed on
Mar 27, 2006
Sold by
Kolle Renee Beth and Swiers Kevin
Bought by
Draeger Thomas C and Coyle Connie S
Home Financials for this Owner
Home Financials are based on the most recent Mortgage that was taken out on this home.
Original Mortgage
$92,000
Interest Rate
6.33%
Mortgage Type
New Conventional
Create a Home Valuation Report for This Property
The Home Valuation Report is an in-depth analysis detailing your home's value as well as a comparison with similar homes in the area
Home Values in the Area
Average Home Value in this Area
Purchase History
| Date | Buyer | Sale Price | Title Company |
|---|---|---|---|
| Anderson John W | $156,000 | Title Co | |
| Draeger Thomas C | -- | -- |
Source: Public Records
Mortgage History
| Date | Status | Borrower | Loan Amount |
|---|---|---|---|
| Open | Anderson John W | $153,174 | |
| Previous Owner | Draeger Thomas C | $92,000 |
Source: Public Records
Tax History Compared to Growth
Tax History
| Year | Tax Paid | Tax Assessment Tax Assessment Total Assessment is a certain percentage of the fair market value that is determined by local assessors to be the total taxable value of land and additions on the property. | Land | Improvement |
|---|---|---|---|---|
| 2024 | $3,224 | $108,750 | $25,800 | $82,950 |
| 2023 | $3,044 | $102,600 | $25,800 | $76,800 |
| 2022 | $2,908 | $95,900 | $25,800 | $70,100 |
| 2021 | $2,561 | $84,650 | $27,000 | $57,650 |
| 2020 | $2,349 | $76,950 | $27,000 | $49,950 |
| 2019 | $1,940 | $72,600 | $15,000 | $57,600 |
| 2018 | $2,037 | $72,600 | $15,000 | $57,600 |
| 2017 | $1,970 | $70,500 | $15,000 | $55,500 |
| 2016 | $1,778 | $68,450 | $15,000 | $53,450 |
| 2015 | $2,011 | $73,150 | $11,250 | $61,900 |
| 2014 | $1,893 | $66,500 | $11,250 | $55,250 |
| 2013 | $1,902 | $66,500 | $11,250 | $55,250 |
Source: Public Records
Map
Nearby Homes
- 1407 17th St S
- 1709 13th Ave S
- 1301 16 1 2 St S
- 2009 13th Ave S
- 2013 13th Ave S
- 2202 15th Ave S
- 1129 22nd St S Unit B09
- 1129 22nd St S Unit B12
- 1545 15th St S
- 1410 14 1 2 St S
- 1637 10th Ave S
- 2402 N Flickertail Dr S Unit 1
- 1418 12th Ave S
- 1550 14 1 2 St S
- 1314 14th St S
- 818 19th St S
- 1418 11th Ave S
- 814 19th St S
- 813 17th St S
- 1737 Park Blvd S