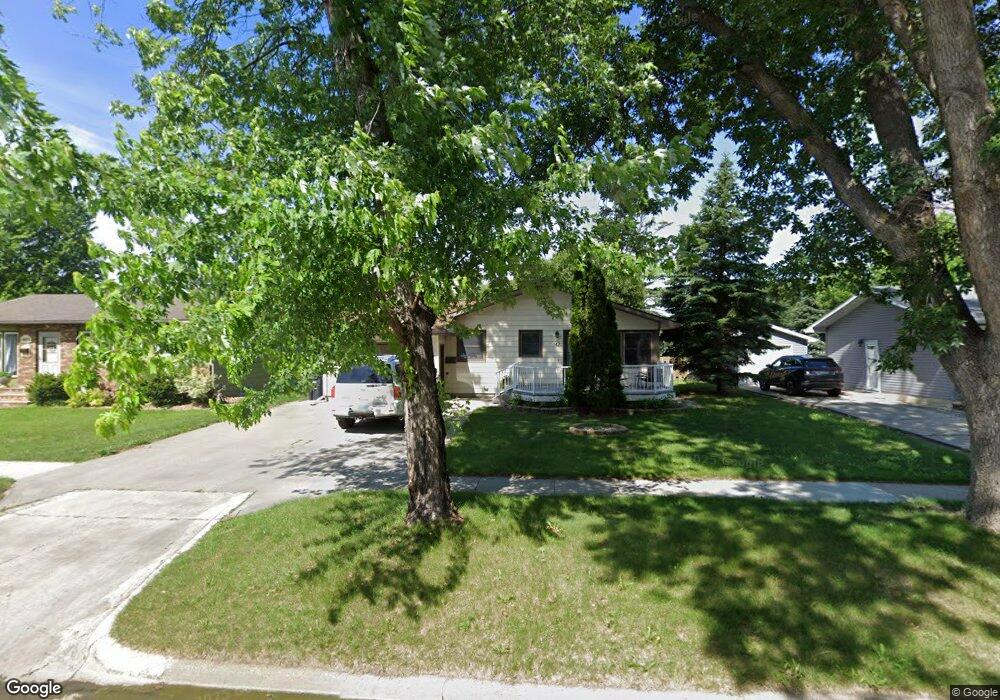
1421 20th St S Fargo, ND 58103
South High NeighborhoodEstimated Value: $272,000 - $291,000
3
Beds
2
Baths
2,016
Sq Ft
$139/Sq Ft
Est. Value
About This Home
This home is located at 1421 20th St S, Fargo, ND 58103 and is currently estimated at $280,263, approximately $139 per square foot. 1421 20th St S is a home located in Cass County with nearby schools including Lewis & Clark Elementary School, Carl Ben Eielson Middle School, and South High School.
Ownership History
Date
Name
Owned For
Owner Type
Purchase Details
Closed on
Nov 28, 2017
Sold by
Jundt Jason
Bought by
Palmier Andre M and Palmier Christina M
Current Estimated Value
Home Financials for this Owner
Home Financials are based on the most recent Mortgage that was taken out on this home.
Original Mortgage
$186,459
Outstanding Balance
$155,161
Interest Rate
3.5%
Mortgage Type
FHA
Estimated Equity
$125,102
Create a Home Valuation Report for This Property
The Home Valuation Report is an in-depth analysis detailing your home's value as well as a comparison with similar homes in the area
Home Values in the Area
Average Home Value in this Area
Purchase History
| Date | Buyer | Sale Price | Title Company |
|---|---|---|---|
| Palmier Andre M | $189,900 | None Available |
Source: Public Records
Mortgage History
| Date | Status | Borrower | Loan Amount |
|---|---|---|---|
| Open | Palmier Andre M | $186,459 |
Source: Public Records
Tax History Compared to Growth
Tax History
| Year | Tax Paid | Tax Assessment Tax Assessment Total Assessment is a certain percentage of the fair market value that is determined by local assessors to be the total taxable value of land and additions on the property. | Land | Improvement |
|---|---|---|---|---|
| 2024 | $3,566 | $124,600 | $25,450 | $99,150 |
| 2023 | $3,360 | $117,550 | $25,450 | $92,100 |
| 2022 | $3,203 | $109,850 | $25,450 | $84,400 |
| 2021 | $2,905 | $100,700 | $26,900 | $73,800 |
| 2020 | $2,650 | $91,550 | $26,900 | $64,650 |
| 2019 | $2,301 | $86,350 | $14,950 | $71,400 |
| 2018 | $2,271 | $86,350 | $14,950 | $71,400 |
| 2017 | $2,300 | $83,850 | $14,950 | $68,900 |
| 2016 | $2,071 | $81,400 | $14,950 | $66,450 |
| 2015 | $1,975 | $72,200 | $11,200 | $61,000 |
| 2014 | $1,891 | $66,850 | $11,200 | $55,650 |
| 2013 | $1,900 | $66,850 | $11,200 | $55,650 |
Source: Public Records
Map
Nearby Homes
- 2013 13th Ave S
- 2009 13th Ave S
- 1407 17th St S
- 2202 15th Ave S
- 1129 22nd St S Unit B09
- 1129 22nd St S Unit B12
- 1301 16 1 2 St S
- 2402 N Flickertail Dr S Unit 1
- 1545 15th St S
- 1737 Park Blvd S
- 818 19th St S
- 1402 E Gateway Cir S Unit M
- 814 19th St S
- 1410 14 1 2 St S
- 813 17th St S
- 1418 12th Ave S
- 1550 14 1 2 St S
- 1418 11th Ave S
- 1314 14th St S
- 1718 15th St S