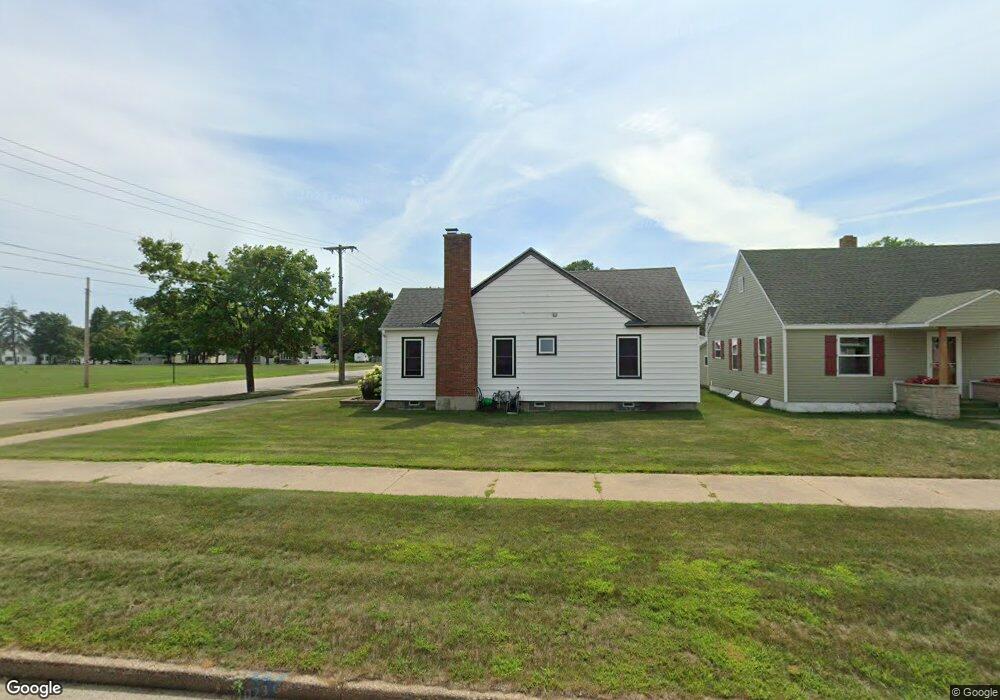
1421 9th Ave S Escanaba, MI 49829
Estimated Value: $192,727 - $230,000
3
Beds
2
Baths
1,736
Sq Ft
$118/Sq Ft
Est. Value
About This Home
This home is located at 1421 9th Ave S, Escanaba, MI 49829 and is currently estimated at $204,682, approximately $117 per square foot. 1421 9th Ave S is a home with nearby schools including Escanaba Jr./Sr. High School, Holy Name Catholic School, and Escanaba Sda School.
Ownership History
Date
Name
Owned For
Owner Type
Purchase Details
Closed on
Sep 4, 2024
Sold by
Lynaugh Laura J
Bought by
Hardwick Hayden
Current Estimated Value
Purchase Details
Closed on
Nov 27, 2013
Sold by
Oslund Candace M
Bought by
Lynaugh Laura J
Home Financials for this Owner
Home Financials are based on the most recent Mortgage that was taken out on this home.
Original Mortgage
$72,659
Interest Rate
4.1%
Mortgage Type
FHA
Purchase Details
Closed on
Oct 26, 2001
Sold by
Thompson Lois J
Bought by
Thompson Lois J Rev Living Trust
Create a Home Valuation Report for This Property
The Home Valuation Report is an in-depth analysis detailing your home's value as well as a comparison with similar homes in the area
Home Values in the Area
Average Home Value in this Area
Purchase History
| Date | Buyer | Sale Price | Title Company |
|---|---|---|---|
| Hardwick Hayden | $195,000 | -- | |
| Lynaugh Laura J | $74,000 | -- | |
| Thompson Lois J Rev Living Trust | -- | -- |
Source: Public Records
Mortgage History
| Date | Status | Borrower | Loan Amount |
|---|---|---|---|
| Previous Owner | Lynaugh Laura J | $72,659 |
Source: Public Records
Tax History
| Year | Tax Paid | Tax Assessment Tax Assessment Total Assessment is a certain percentage of the fair market value that is determined by local assessors to be the total taxable value of land and additions on the property. | Land | Improvement |
|---|---|---|---|---|
| 2025 | $2,512 | $79,600 | $0 | $0 |
| 2024 | $1,896 | $71,400 | $0 | $0 |
| 2023 | $1,808 | $64,800 | $0 | $0 |
| 2022 | $2,307 | $56,400 | $0 | $0 |
| 2021 | $2,224 | $53,600 | $0 | $0 |
| 2020 | $2,202 | $54,800 | $0 | $0 |
| 2019 | $2,133 | $51,000 | $0 | $0 |
| 2018 | $2,085 | $50,500 | $0 | $0 |
| 2017 | $1,523 | $50,597 | $0 | $0 |
| 2016 | $2,001 | $50,371 | $0 | $0 |
| 2014 | $1,399 | $47,500 | $0 | $0 |
| 2013 | $1,399 | $57,200 | $0 | $0 |
Source: Public Records
Map
Nearby Homes
- 1524 9th Ave S
- 910 13th St S
- 804 S 13th St
- 1020 S 18th St
- 1824 9th Ave S
- 509 S 10th St
- 517 S 9th St
- 1930 S 22nd St
- 1605 17th Ave S
- 1617 17th Ave S
- 417 S 8th St
- 1114 1st Ave S
- 605 Ogden Ave
- 113 S 10th St
- 314 S 6th St
- 219 N 20th St
- 206 N 21st
- 2414 Ludington St
- 200 Ludington Unit 12 St Unit 12
- 200 Ludington Unit 5 St Unit 5
Your Personal Tour Guide
Ask me questions while you tour the home.