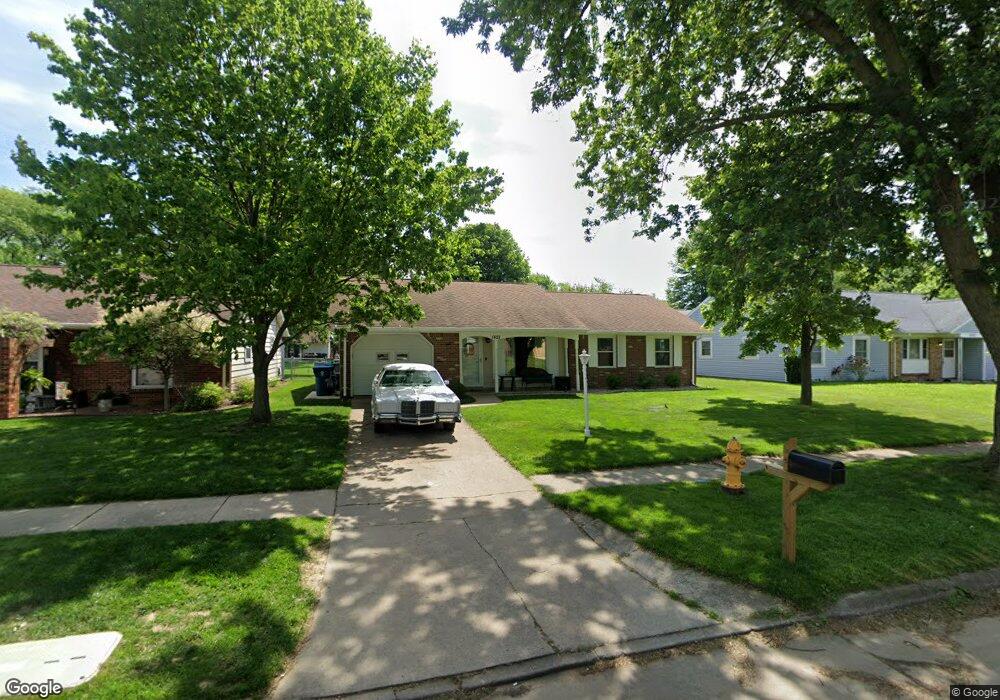
1421 Alger St Fremont, OH 43420
Estimated Value: $150,000 - $193,000
3
Beds
2
Baths
1,132
Sq Ft
$150/Sq Ft
Est. Value
About This Home
This home is located at 1421 Alger St, Fremont, OH 43420 and is currently estimated at $170,274, approximately $150 per square foot. 1421 Alger St is a home located in Sandusky County with nearby schools including Fremont Ross High School, St. Ann Catholic School, and St. Joseph School.
Ownership History
Date
Name
Owned For
Owner Type
Purchase Details
Closed on
May 20, 2020
Sold by
Ingles John W and Ingles Leslie Yvette
Bought by
Ingles John W and Ingles Leslie Yvette
Current Estimated Value
Home Financials for this Owner
Home Financials are based on the most recent Mortgage that was taken out on this home.
Original Mortgage
$65,000
Outstanding Balance
$45,466
Interest Rate
3.3%
Mortgage Type
New Conventional
Estimated Equity
$124,808
Purchase Details
Closed on
Oct 27, 2011
Sold by
Crum Brianne M
Bought by
Ingles John W
Home Financials for this Owner
Home Financials are based on the most recent Mortgage that was taken out on this home.
Original Mortgage
$83,125
Interest Rate
4.12%
Mortgage Type
New Conventional
Purchase Details
Closed on
Jul 19, 2005
Sold by
Hyde Robert L
Bought by
Crum Brianne M
Home Financials for this Owner
Home Financials are based on the most recent Mortgage that was taken out on this home.
Original Mortgage
$84,900
Interest Rate
5.69%
Mortgage Type
Fannie Mae Freddie Mac
Create a Home Valuation Report for This Property
The Home Valuation Report is an in-depth analysis detailing your home's value as well as a comparison with similar homes in the area
Home Values in the Area
Average Home Value in this Area
Purchase History
| Date | Buyer | Sale Price | Title Company |
|---|---|---|---|
| Ingles John W | -- | None Available | |
| Ingles John W | $87,500 | First American | |
| Crum Brianne M | $63,675 | Firelands Abstract & Title |
Source: Public Records
Mortgage History
| Date | Status | Borrower | Loan Amount |
|---|---|---|---|
| Open | Ingles John W | $65,000 | |
| Closed | Ingles John W | $83,125 | |
| Previous Owner | Crum Brianne M | $84,900 |
Source: Public Records
Tax History Compared to Growth
Tax History
| Year | Tax Paid | Tax Assessment Tax Assessment Total Assessment is a certain percentage of the fair market value that is determined by local assessors to be the total taxable value of land and additions on the property. | Land | Improvement |
|---|---|---|---|---|
| 2024 | $1,731 | $46,980 | $11,730 | $35,250 |
| 2023 | $1,731 | $34,790 | $8,680 | $26,110 |
| 2022 | $1,348 | $34,790 | $8,680 | $26,110 |
| 2021 | $1,392 | $34,790 | $8,680 | $26,110 |
| 2020 | $1,278 | $31,470 | $8,680 | $22,790 |
| 2019 | $1,276 | $31,470 | $8,680 | $22,790 |
| 2018 | $1,281 | $31,470 | $8,680 | $22,790 |
| 2017 | $1,283 | $31,470 | $8,680 | $22,790 |
| 2016 | $1,125 | $31,470 | $8,680 | $22,790 |
| 2015 | $1,107 | $31,470 | $8,680 | $22,790 |
| 2014 | $1,179 | $31,960 | $8,680 | $23,280 |
| 2013 | $1,153 | $31,960 | $8,680 | $23,280 |
Source: Public Records
Map
Nearby Homes
- 1441 White Ave
- 1548 North St
- 1720 North St
- 1120 Carbon St
- 818 Franklin Ave
- 2935 Us Highway 6
- 1823 W State St
- 2100 Ohio 53
- 900 Spring St
- 711 Rawson Ave
- 816 Lime St
- 501 Jackson St Unit 50
- 2119 Lake St
- 1730 Port Clinton Rd Unit 41
- 1730 Port Clinton Rd Unit 33
- 1009 Napoleon St
- 427 N Clover St
- 0 Sean Dr
- Outlot A Sean Dr
- 515 Everett Rd
- 1425 Alger St
- 1415 Alger St
- 1431 Alger St
- 1409 Alger St
- 1424 White Ave
- 1414 White Ave
- 1418 Alger St Unit 14
- 1410 White Ave
- 1430 White Ave
- 1424 Alger St Unit 14
- 1414 Alger St Unit 14
- 1403 Alger St
- 1430 Alger St Unit 14
- 1410 Alger St Unit 14
- 1436 White Ave
- 1402 White Ave
- 1441 Alger St
- 1436 Alger St Unit 14
- 1406 Alger St Unit 14
- 1440 White Ave