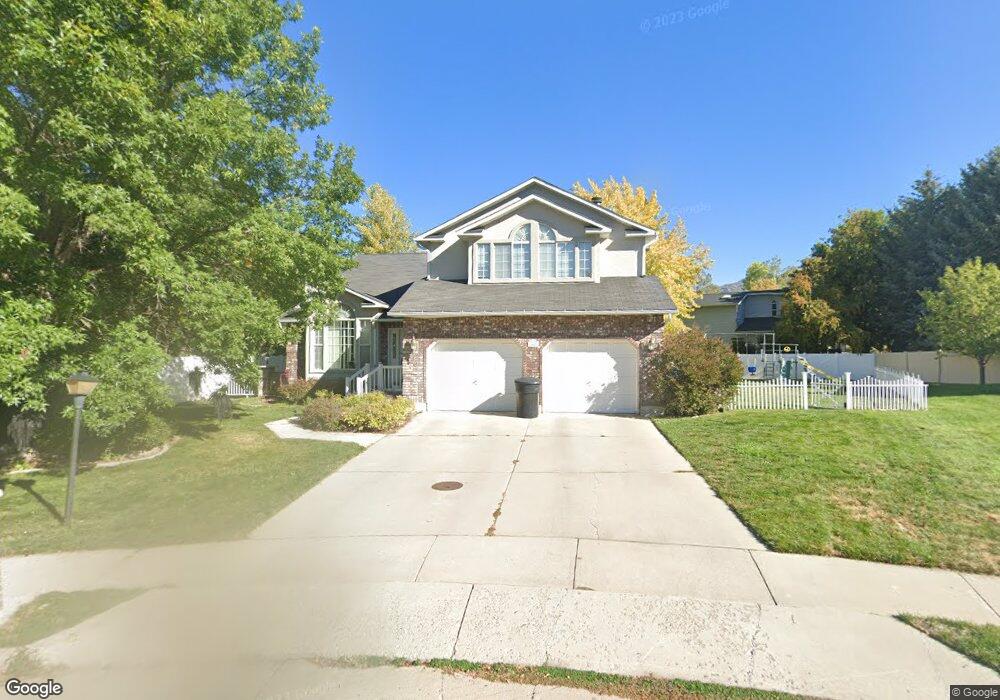
1421 E 260 N Logan, UT 84321
Wilson NeighborhoodEstimated Value: $562,000 - $623,000
5
Beds
4
Baths
3,424
Sq Ft
$170/Sq Ft
Est. Value
About This Home
This home is located at 1421 E 260 N, Logan, UT 84321 and is currently estimated at $582,933, approximately $170 per square foot. 1421 E 260 N is a home located in Cache County with nearby schools including Wilson School, Mount Logan Middle School, and Logan High School.
Ownership History
Date
Name
Owned For
Owner Type
Purchase Details
Closed on
Apr 22, 2022
Sold by
Michaelis Brigham T and Michaelis Stephanina
Bought by
Christensen Greg
Current Estimated Value
Purchase Details
Closed on
Aug 17, 2016
Sold by
Jang Sung Soo
Bought by
Michaelis Brigham T and Michaelis Stephanina
Home Financials for this Owner
Home Financials are based on the most recent Mortgage that was taken out on this home.
Original Mortgage
$149,650
Interest Rate
3.45%
Mortgage Type
New Conventional
Purchase Details
Closed on
Aug 12, 2009
Sold by
Lindbloom Katherine C
Bought by
Jang Sung Soo
Home Financials for this Owner
Home Financials are based on the most recent Mortgage that was taken out on this home.
Original Mortgage
$198,400
Interest Rate
5.3%
Mortgage Type
New Conventional
Create a Home Valuation Report for This Property
The Home Valuation Report is an in-depth analysis detailing your home's value as well as a comparison with similar homes in the area
Home Values in the Area
Average Home Value in this Area
Purchase History
| Date | Buyer | Sale Price | Title Company |
|---|---|---|---|
| Christensen Greg | -- | Pinnacle Title | |
| Michaelis Brigham T | -- | Northern Title | |
| Jang Sung Soo | -- | Cache Title Company |
Source: Public Records
Mortgage History
| Date | Status | Borrower | Loan Amount |
|---|---|---|---|
| Previous Owner | Michaelis Brigham T | $149,650 | |
| Previous Owner | Jang Sung Soo | $198,400 |
Source: Public Records
Tax History
| Year | Tax Paid | Tax Assessment Tax Assessment Total Assessment is a certain percentage of the fair market value that is determined by local assessors to be the total taxable value of land and additions on the property. | Land | Improvement |
|---|---|---|---|---|
| 2025 | $2,451 | $317,045 | $0 | $0 |
| 2023 | $2,632 | $314,215 | $0 | $0 |
| 2022 | $2,843 | $316,965 | $0 | $0 |
| 2021 | $2,261 | $389,475 | $75,000 | $314,475 |
| 2020 | $2,202 | $341,409 | $75,000 | $266,409 |
| 2019 | $2,302 | $341,409 | $75,000 | $266,409 |
| 2018 | $2,265 | $306,660 | $75,000 | $231,660 |
| 2017 | $2,117 | $151,580 | $0 | $0 |
| 2016 | $2,195 | $151,580 | $0 | $0 |
| 2015 | $1,780 | $122,765 | $0 | $0 |
| 2014 | $1,609 | $122,765 | $0 | $0 |
| 2013 | -- | $122,765 | $0 | $0 |
Source: Public Records
Map
Nearby Homes
- 1387 E 260 N
- 1374 E 260 N
- 1535 Sumac Dr
- 147 Winding Way Unit 50
- 128 S 1170 E
- 1034 Thrushwood Dr
- 1045 Fox Farm Rd
- 1147 Eastridge Dr
- 1647 E Quail Canyon Dr
- 1374 Maple Dr
- 74 Canterbury Cir
- 825 N 1400 E
- 1164 E Mountain Rd
- 866 Hillcrest Ave
- 28 River Pointe Dr
- 2758 N Canyon Cove Dr
- 2738 N Canyon Cove Dr
- 70 River Pointe Dr
- 684 Apple Dr
- 45 River Circle Dr
Your Personal Tour Guide
Ask me questions while you tour the home.