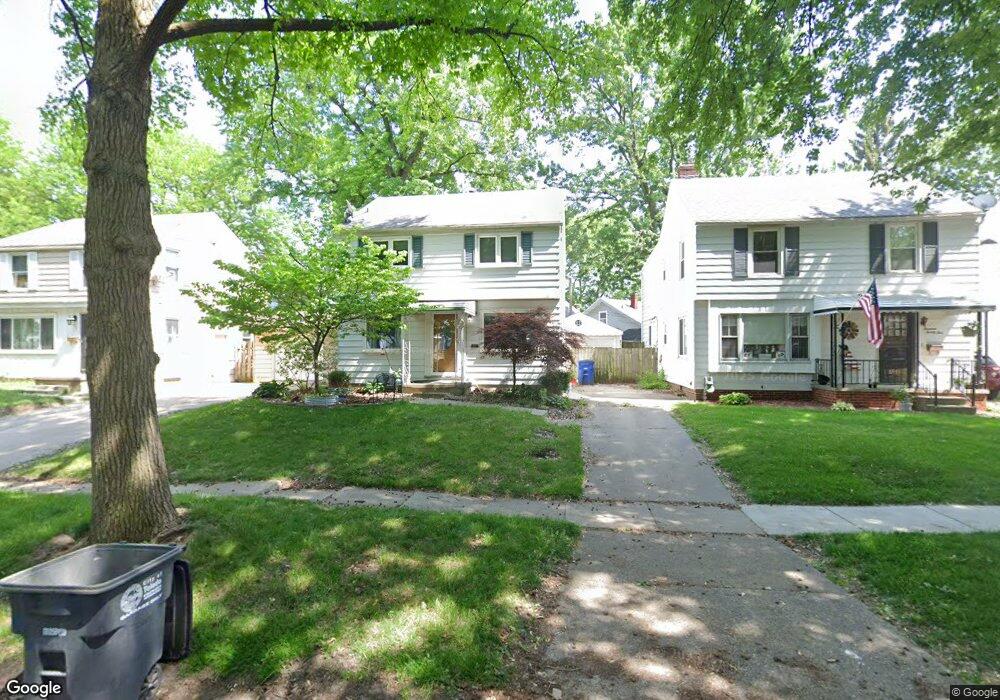
1421 Hagley Rd Toledo, OH 43612
Five Points NeighborhoodEstimated Value: $78,000 - $121,000
3
Beds
2
Baths
1,196
Sq Ft
$86/Sq Ft
Est. Value
About This Home
This home is located at 1421 Hagley Rd, Toledo, OH 43612 and is currently estimated at $102,513, approximately $85 per square foot. 1421 Hagley Rd is a home located in Lucas County with nearby schools including Larchmont Elementary School, Start High School, and Bennett Venture Academy.
Ownership History
Date
Name
Owned For
Owner Type
Purchase Details
Closed on
Apr 12, 2022
Sold by
Degolier Lynnette J
Bought by
Jeffery Richardson
Current Estimated Value
Home Financials for this Owner
Home Financials are based on the most recent Mortgage that was taken out on this home.
Interest Rate
4.72%
Purchase Details
Closed on
Feb 11, 2022
Sold by
Degolier Lynnette and Glauser Andrea
Bought by
Richardson Jeffery
Home Financials for this Owner
Home Financials are based on the most recent Mortgage that was taken out on this home.
Interest Rate
4.72%
Purchase Details
Closed on
Dec 11, 2010
Sold by
Degolier Lynette and Glauser Andrea
Bought by
Richardson Jeffery
Home Financials for this Owner
Home Financials are based on the most recent Mortgage that was taken out on this home.
Original Mortgage
$55,000
Interest Rate
4.22%
Mortgage Type
Seller Take Back
Purchase Details
Closed on
Jun 1, 2010
Sold by
Degolier Lynnette J
Bought by
Degolier Lynnette J and Glauser Andrea J
Purchase Details
Closed on
Apr 27, 2004
Sold by
Pietkowski Leonard J
Bought by
Pietkowski Leonard J and The Leonard J Pietkowski Trust
Create a Home Valuation Report for This Property
The Home Valuation Report is an in-depth analysis detailing your home's value as well as a comparison with similar homes in the area
Home Values in the Area
Average Home Value in this Area
Purchase History
| Date | Buyer | Sale Price | Title Company |
|---|---|---|---|
| Jeffery Richardson | $55,000 | -- | |
| Richardson Jeffery | $55,000 | None Listed On Document | |
| Richardson Jeffery | $55,000 | Attorney | |
| Degolier Lynnette J | -- | Attorney | |
| Pietkowski Leonard J | -- | -- |
Source: Public Records
Mortgage History
| Date | Status | Borrower | Loan Amount |
|---|---|---|---|
| Closed | Jeffery Richardson | -- | |
| Previous Owner | Richardson Jeffery | $55,000 |
Source: Public Records
Tax History Compared to Growth
Tax History
| Year | Tax Paid | Tax Assessment Tax Assessment Total Assessment is a certain percentage of the fair market value that is determined by local assessors to be the total taxable value of land and additions on the property. | Land | Improvement |
|---|---|---|---|---|
| 2024 | $1,770 | $26,320 | $5,810 | $20,510 |
| 2023 | $1,551 | $23,100 | $4,725 | $18,375 |
| 2022 | $1,569 | $23,100 | $4,725 | $18,375 |
| 2021 | $1,618 | $23,100 | $4,725 | $18,375 |
| 2020 | $1,572 | $19,565 | $4,025 | $15,540 |
| 2019 | $1,521 | $19,565 | $4,025 | $15,540 |
| 2018 | $1,538 | $19,565 | $4,025 | $15,540 |
| 2017 | $1,542 | $19,110 | $4,585 | $14,525 |
| 2016 | $1,547 | $54,600 | $13,100 | $41,500 |
| 2015 | $1,554 | $54,600 | $13,100 | $41,500 |
| 2014 | $1,236 | $19,120 | $4,590 | $14,530 |
| 2013 | $1,236 | $19,120 | $4,590 | $14,530 |
Source: Public Records
Map
Nearby Homes
- 1351 Corbin Rd
- 1308 Crestwood Rd
- 4612 Willys Pkwy
- 1546 Gould Rd
- 1230 Corbin Rd
- 1416 Sabra Rd
- 4526 Eastway St
- 4360 Overland Pkwy
- 1512 Schuyler Rd
- 4322 Lowe Rd
- 4319 Parrakeet Ave
- 1643 Hagley Rd
- 4341 Lyman Ave
- 1126 Slater St
- 4329 Commonwealth Ave
- 1023 Hawk St
- 4352 Berwick Ave
- 4623 Lewis Ave
- 4203 Birchall Rd
- 4214 Kingsbury Ave
- 1425 Hagley Rd
- 4621 Overland Pkwy
- 1417 Hagley Rd
- 1429 Hagley Rd
- 4617 Overland Pkwy
- 4625 Overland Pkwy
- 1433 Hagley Rd
- 4611 Overland Pkwy
- 1428 Hagley Rd
- 4609 Overland Pkwy
- 1437 Hagley Rd
- 1445 Hagley Rd
- 1425 Crestwood Rd
- 1434 Hagley Rd
- 4607 Overland Pkwy
- 1414 Corbin Rd
- 1418 Corbin Rd
- 1440 Hagley Rd
- 4622 Overland Pkwy
- 1431 Crestwood Rd