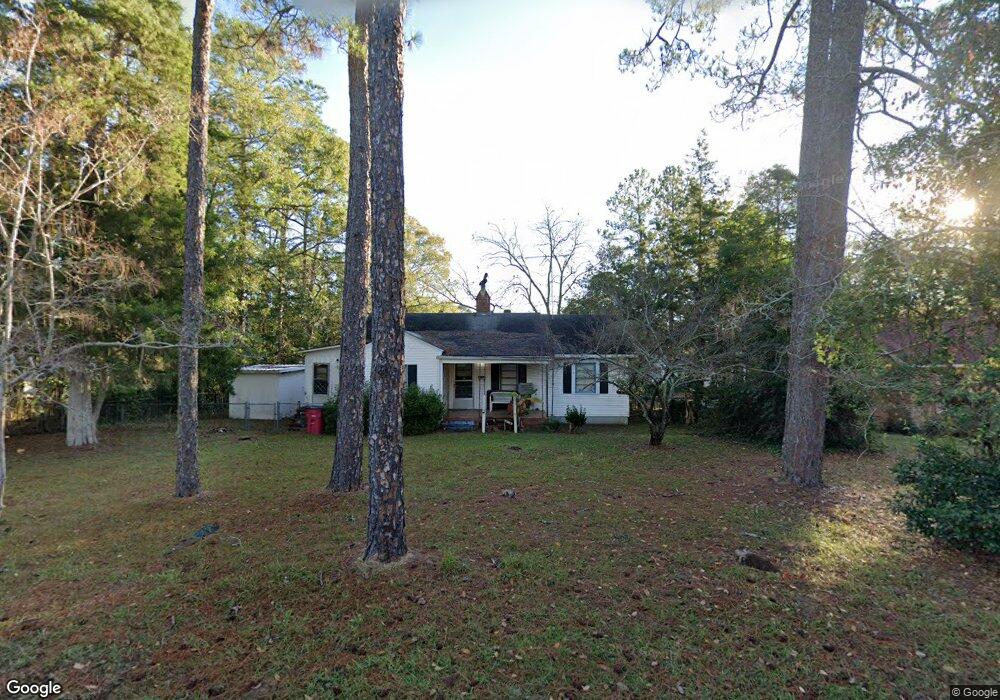
1421 Missouri Ave Tifton, GA 31794
Estimated Value: $114,804 - $174,000
3
Beds
2
Baths
1,415
Sq Ft
$99/Sq Ft
Est. Value
About This Home
This home is located at 1421 Missouri Ave, Tifton, GA 31794 and is currently estimated at $139,701, approximately $98 per square foot. 1421 Missouri Ave is a home located in Tift County with nearby schools including Len Lastinger Primary School, Charles Spencer Elementary School, and J.T. Reddick School.
Ownership History
Date
Name
Owned For
Owner Type
Purchase Details
Closed on
Nov 8, 2012
Sold by
Daniel W F
Bought by
Maloy Daniel W Jr Life Estate
Current Estimated Value
Purchase Details
Closed on
Dec 5, 2003
Sold by
Maloy Joseph T
Bought by
Maloy Daniel W F and Maloy Joseph T
Purchase Details
Closed on
Jan 15, 2002
Sold by
Maloy Fran
Bought by
Maloy Joseph T
Purchase Details
Closed on
Sep 11, 1990
Sold by
Maloy Joseph T
Bought by
Maloy Joseph T and Maloy Fran
Purchase Details
Closed on
Aug 30, 1990
Sold by
Maloy Fran
Bought by
Maloy Joseph T
Purchase Details
Closed on
Nov 28, 1988
Sold by
Maloy Joseph T
Bought by
Maloy Fran
Purchase Details
Closed on
Oct 19, 1988
Sold by
Paulk Robert E and Paulk Phyllis A
Bought by
Maloy Joseph T and Maloy Fran
Purchase Details
Closed on
Feb 26, 1979
Sold by
Paulk Robert E
Bought by
Paulk Robert E and Paulk Phyllis A
Purchase Details
Closed on
Jan 15, 1979
Sold by
Woodall Walter O
Bought by
Paulk Robert E
Create a Home Valuation Report for This Property
The Home Valuation Report is an in-depth analysis detailing your home's value as well as a comparison with similar homes in the area
Home Values in the Area
Average Home Value in this Area
Purchase History
| Date | Buyer | Sale Price | Title Company |
|---|---|---|---|
| Maloy Daniel W Jr Life Estate | -- | -- | |
| Maloy Daniel W F | -- | -- | |
| Maloy Joseph T | -- | -- | |
| Maloy Joseph T | -- | -- | |
| Maloy Joseph T | -- | -- | |
| Maloy Fran | -- | -- | |
| Maloy Joseph T | $28,000 | -- | |
| Paulk Robert E | $6,000 | -- | |
| Paulk Robert E | $19,600 | -- |
Source: Public Records
Tax History Compared to Growth
Tax History
| Year | Tax Paid | Tax Assessment Tax Assessment Total Assessment is a certain percentage of the fair market value that is determined by local assessors to be the total taxable value of land and additions on the property. | Land | Improvement |
|---|---|---|---|---|
| 2024 | $454 | $16,839 | $2,000 | $14,839 |
| 2023 | $483 | $24,236 | $2,640 | $21,596 |
| 2022 | $912 | $24,236 | $2,640 | $21,596 |
| 2021 | $918 | $24,236 | $2,640 | $21,596 |
| 2020 | $487 | $24,236 | $2,640 | $21,596 |
| 2019 | $487 | $24,236 | $2,640 | $21,596 |
| 2018 | $488 | $24,236 | $2,640 | $21,596 |
| 2017 | $502 | $24,236 | $2,640 | $21,596 |
| 2016 | $502 | $24,236 | $2,640 | $21,596 |
| 2015 | $502 | $24,236 | $2,640 | $21,596 |
| 2014 | $502 | $24,236 | $2,640 | $21,596 |
| 2013 | -- | $24,236 | $2,640 | $21,596 |
Source: Public Records
Map
Nearby Homes
- 2202 Emory Dr
- 0 N U S Hwy 41
- 2021 Emory Dr
- 1601 Murray Ave
- 307 Fulwood Blvd
- 711 10th St W
- 225 Alabama Dr
- 0 Penn Place
- 2609 Emmett Dr
- 523 Alabama Dr Unit 15 & PT 16
- 523 Alabama Dr
- 1617 Wilson Ave N
- 803 Forest Ave
- 821 Murray Ave
- 803 Forrest Ave
- 0 US Highway 41 Unit 137727
- 0 Lee Ball Rd
- 0 Central Ave Unit 138182
- 0 Central Ave Unit 137897
- 0 Central Ave Unit 137896
- 1423 Missouri Ave
- 1419 Missouri Ave
- 1425 Missouri Ave
- 1412 Missouri Ave
- 1410 Missouri Ave
- 1417 Missouri Ave
- 1414 Missouri Ave
- 1804 Us Highway 41 N
- 1427 Missouri Ave
- 1416 Missouri Ave
- 1406 Missouri Ave
- 1421 Moore Hwy
- 1406 Missouri Ave
- 1610 Us Highway 41 N
- 1820 N Us Hwy 41
- 1820 Us Highway 41 N
- 1415 Missouri Ave
- 1801 N Us Hwy 41
- 1418 Missouri Ave
- 1419 Moore Hwy