1421 Northgate Rd Springfield, OH 45504
Estimated Value: $198,000 - $223,000
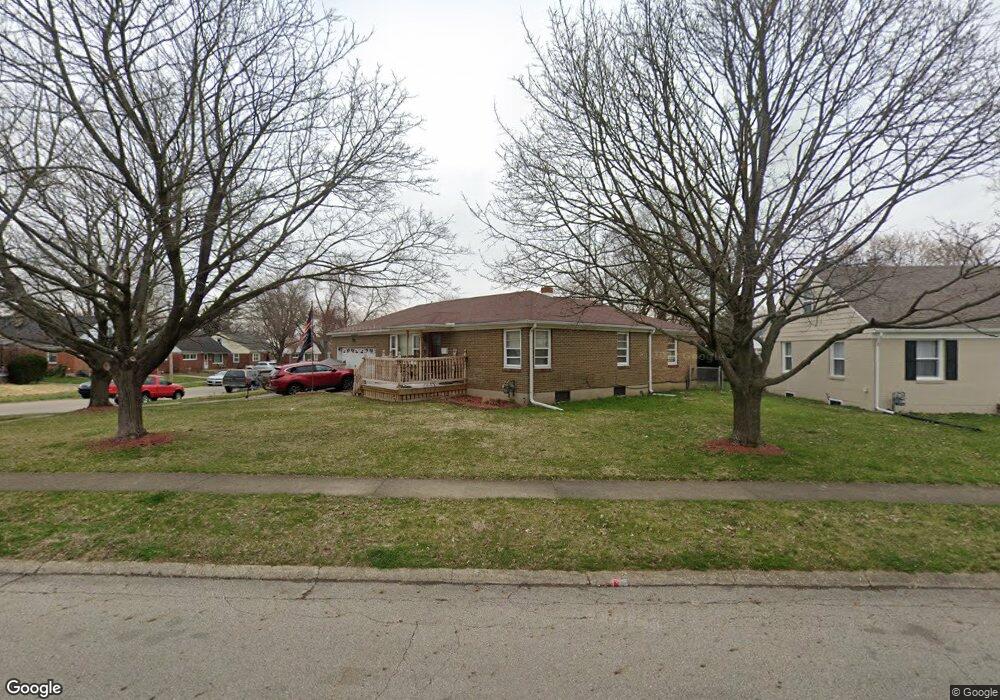
About This Home
This home is located at 1421 Northgate Rd, Springfield, OH 45504 and is currently estimated at $214,563, approximately $145 per square foot. 1421 Northgate Rd is a home located in Clark County with nearby schools including Snowhill Elementary School, Roosevelt Middle School, and Springfield High School.
Ownership History
We collect this data history from publicly available records. To have your information removed, we recommend requesting removal directly through your county’s website.
Purchase Details
Home Financials for this Owner
Home Financials are based on the most recent Mortgage that was taken out on this home.Purchase Details
Purchase Details
Purchase Details
Home Financials for this Owner
Home Financials are based on the most recent Mortgage that was taken out on this home.Home Values in the Area
Average Home Value in this Area
Purchase History
We collect this data history from publicly available records. To have your information removed, we recommend requesting removal directly through your county’s website.
| Date | Buyer | Sale Price | Title Company |
|---|---|---|---|
| $122,000 | -- | ||
| $77,250 | -- | ||
| $90,000 | -- | ||
| $95,000 | -- |
Mortgage History
We collect this data history from publicly available records. To have your information removed, we recommend requesting removal directly through your county’s website.
| Date | Status | Borrower | Loan Amount |
|---|---|---|---|
| Open | $109,800 | ||
| Previous Owner | $94,200 |
Tax History
We collect this data history from publicly available records. To have your information removed, we recommend requesting removal directly through your county’s website.
| Year | Tax Paid | Tax Assessment Tax Assessment Total Assessment is a certain percentage of the fair market value that is determined by local assessors to be the total taxable value of land and additions on the property. | Land | Improvement |
|---|---|---|---|---|
| 2025 | $2,348 | $63,150 | $8,460 | $54,690 |
| 2024 | $2,287 | $47,450 | $7,790 | $39,660 |
| 2023 | $2,287 | $47,450 | $7,790 | $39,660 |
| 2022 | $2,342 | $47,450 | $7,790 | $39,660 |
| 2021 | $1,834 | $34,300 | $6,040 | $28,260 |
| 2020 | $1,838 | $34,300 | $6,040 | $28,260 |
| 2019 | $1,843 | $34,300 | $6,040 | $28,260 |
| 2018 | $1,622 | $29,010 | $5,570 | $23,440 |
| 2017 | $1,621 | $34,983 | $5,572 | $29,411 |
| 2016 | $1,623 | $34,983 | $5,572 | $29,411 |
| 2015 | $1,755 | $32,221 | $5,257 | $26,964 |
| 2014 | $1,748 | $32,221 | $5,257 | $26,964 |
| 2013 | $1,729 | $32,221 | $5,257 | $26,964 |
Map
- 1617 Northgate Rd
- 1402 Malden Ave
- 1708 Brookhollow Dr
- 1329 Lamar Dr
- 1224 Beverly Ave
- 656 Mayhill Rd
- 505 Ridgeview Ct
- 1015 Hillcrest Ave
- 1421 Darwin Ave
- 1243 N Plum St
- 1320 N Plum St
- 409 S Broadmoor Blvd
- 1707 Longview Dr
- 327 Ardmore Rd
- 124 Hawthorne Rd
- 366 N Isabella St
- 408 N Bell Ave
- 1111 Broadway St
- 908 Cedar St
- 263 N Isabella St Unit 265
- 1427 Northgate Rd
- 1538 Malden Ave
- 1501 Northgate Rd
- 1422 Northgate Rd
- 1527 Malden Ave
- 1533 Malden Ave
- 1530 Shelby Dr
- 1540 Shelby Dr
- 1539 Malden Ave
- 1430 Northgate Rd
- 1505 Northgate Rd
- 1515 Malden Ave
- 1546 Shelby Dr
- 1506 Malden Ave
- 1513 Northgate Rd
- 1549 Malden Ave
- 1500 Malden Ave
- 1509 Amherst Rd
- 1524 Briarwood Terrace
- 1536 Briarwood Terrace
Ask me questions while you tour the home.