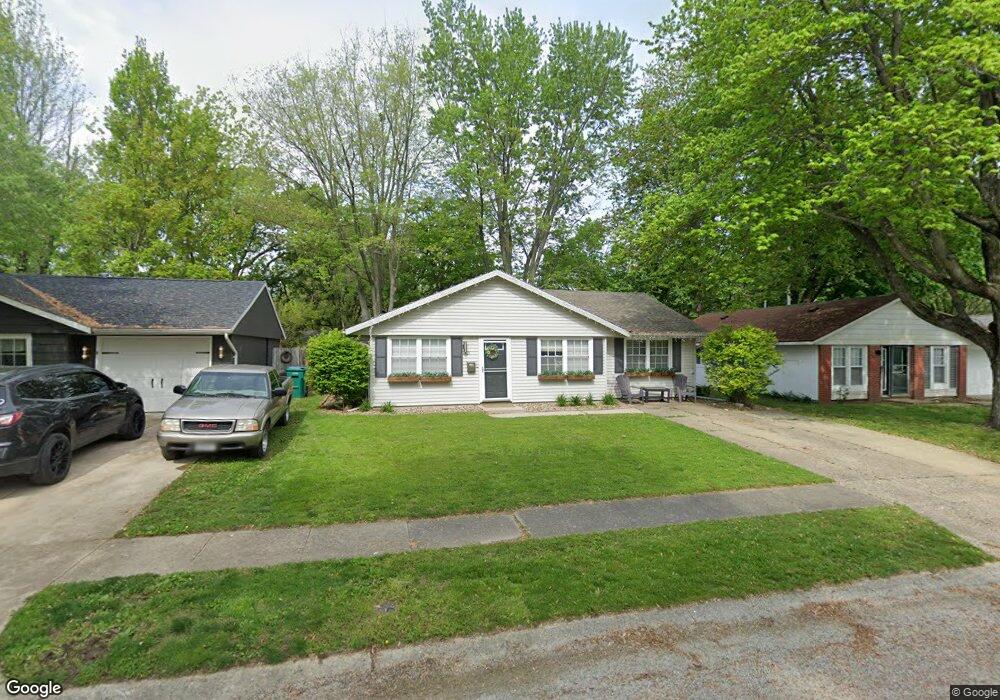
1421 S 2nd St Mattoon, IL 61938
Estimated Value: $85,952 - $114,000
3
Beds
1
Bath
1,213
Sq Ft
$81/Sq Ft
Est. Value
About This Home
This home is located at 1421 S 2nd St, Mattoon, IL 61938 and is currently estimated at $98,488, approximately $81 per square foot. 1421 S 2nd St is a home located in Coles County with nearby schools including Mattoon High School, St. John's Lutheran School, and St Mary School.
Ownership History
Date
Name
Owned For
Owner Type
Purchase Details
Closed on
Mar 30, 2012
Sold by
Baker Dustin E and Baker Lesley E
Bought by
Baker Myah Denee
Current Estimated Value
Home Financials for this Owner
Home Financials are based on the most recent Mortgage that was taken out on this home.
Original Mortgage
$59,160
Outstanding Balance
$40,882
Interest Rate
3.92%
Mortgage Type
New Conventional
Estimated Equity
$57,606
Purchase Details
Closed on
Oct 27, 2005
Sold by
Good David and Good Diane L
Bought by
Baker Dustin E and Baker Lesley E
Purchase Details
Closed on
Jul 13, 2005
Sold by
Secretary Of Hud
Bought by
Good David
Home Financials for this Owner
Home Financials are based on the most recent Mortgage that was taken out on this home.
Original Mortgage
$35,000
Interest Rate
5.69%
Mortgage Type
Future Advance Clause Open End Mortgage
Create a Home Valuation Report for This Property
The Home Valuation Report is an in-depth analysis detailing your home's value as well as a comparison with similar homes in the area
Home Values in the Area
Average Home Value in this Area
Purchase History
We collect this data history from publicly available records. To have your information removed, we recommend requesting removal directly through your county’s website.
| Date | Buyer | Sale Price | Title Company |
|---|---|---|---|
| Baker Myah Denee | $58,000 | None Available | |
| Baker Dustin E | $59,000 | None Available | |
| Good David | $26,500 | None Available |
Source: Public Records
Mortgage History
We collect this data history from publicly available records. To have your information removed, we recommend requesting removal directly through your county’s website.
| Date | Status | Borrower | Loan Amount |
|---|---|---|---|
| Open | Baker Myah Denee | $59,160 | |
| Previous Owner | Good David | $35,000 |
Source: Public Records
Tax History
| Year | Tax Paid | Tax Assessment Tax Assessment Total Assessment is a certain percentage of the fair market value that is determined by local assessors to be the total taxable value of land and additions on the property. | Land | Improvement |
|---|---|---|---|---|
| 2024 | $1,655 | $25,192 | $1,899 | $23,293 |
| 2023 | $1,440 | $22,696 | $1,711 | $20,985 |
| 2022 | $1,440 | $22,321 | $1,683 | $20,638 |
| 2021 | $1,383 | $20,109 | $1,516 | $18,593 |
| 2020 | $1,363 | $20,835 | $3,032 | $17,803 |
| 2019 | $1,321 | $20,109 | $2,926 | $17,183 |
| 2018 | $1,296 | $20,109 | $2,926 | $17,183 |
| 2017 | $1,294 | $20,109 | $2,926 | $17,183 |
| 2016 | $1,265 | $20,109 | $2,926 | $17,183 |
| 2015 | $1,534 | $19,715 | $2,869 | $16,846 |
| 2014 | $1,534 | $19,715 | $2,869 | $16,846 |
| 2013 | $1,534 | $19,330 | $2,869 | $16,461 |
Source: Public Records
Map
Nearby Homes
- LOT 37 Broadmoor Edgewater
- 600 Oklahoma Ave
- 1104 Annis Ave
- 609 Marshall Ave
- 601 Marshall Ave
- 43 Elm Ridge
- 1409 S 14th St
- 301 Wabash Ave
- 609 Wabash Ave
- 1507 Rudy Ave
- 817 Wabash Ave
- 511 Broadway Ave Unit 101
- 1104 S 17th St
- 1101 Wabash Ave
- 1312 Edgar Ave
- 1301 Lafayette Ave
- 425 Crestmore Ave
- 1412 Edgar Ave
- 1509 Lafayette Ave
- 1621 Edgar Ave
Your Personal Tour Guide
Ask me questions while you tour the home.