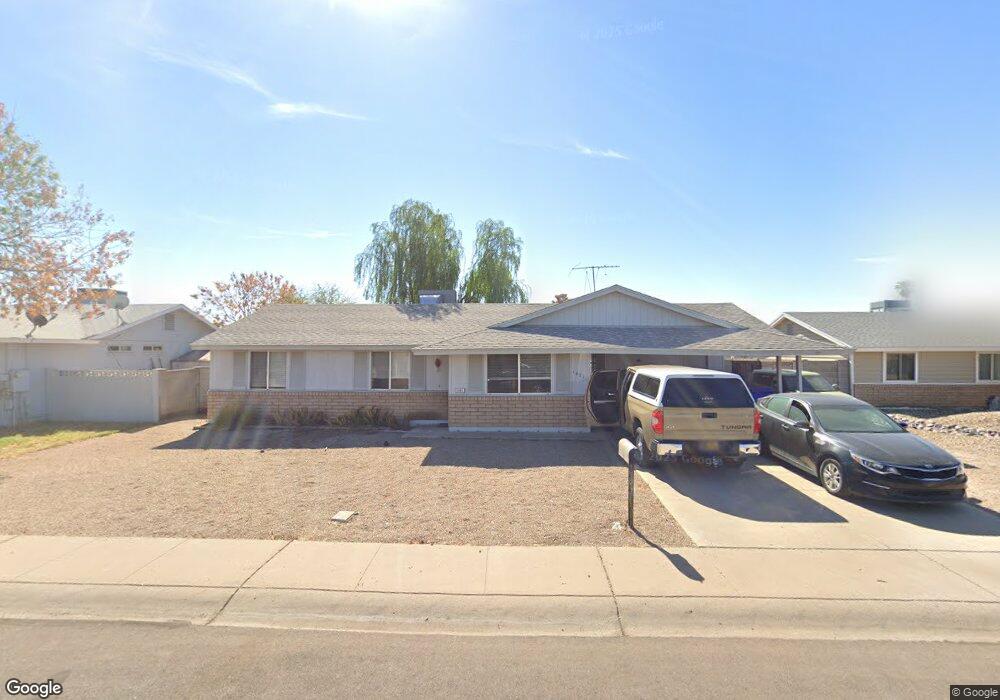
1421 W El Monte Place Chandler, AZ 85224
Amberwood NeighborhoodEstimated Value: $220,252 - $490,000
--
Bed
2
Baths
1,290
Sq Ft
$251/Sq Ft
Est. Value
About This Home
This home is located at 1421 W El Monte Place, Chandler, AZ 85224 and is currently estimated at $323,563, approximately $250 per square foot. 1421 W El Monte Place is a home located in Maricopa County with nearby schools including Pomeroy Elementary School, Franklin at Brimhall Elementary School, and Summit Academy Elementary.
Ownership History
Date
Name
Owned For
Owner Type
Purchase Details
Closed on
Dec 19, 2024
Sold by
Hari Jeffrey A
Bought by
Hari Ryan Ernest and Hari Jeffrey A
Current Estimated Value
Home Financials for this Owner
Home Financials are based on the most recent Mortgage that was taken out on this home.
Original Mortgage
$229,200
Outstanding Balance
$227,397
Interest Rate
6.79%
Mortgage Type
New Conventional
Estimated Equity
$96,166
Purchase Details
Closed on
Oct 7, 2024
Sold by
Charlene E Freitag Family Trust and Freitag Aisia
Bought by
Hari Jeffrey A
Purchase Details
Closed on
Jun 8, 2023
Sold by
Freitag Charlene E
Bought by
Charlene E Freitag Family Trust and Freitag
Purchase Details
Closed on
Jan 21, 1997
Sold by
Roman Charles and Roman Evelyn G
Bought by
Freitag Charlene E and Charlene E Freitag Family Trust
Create a Home Valuation Report for This Property
The Home Valuation Report is an in-depth analysis detailing your home's value as well as a comparison with similar homes in the area
Home Values in the Area
Average Home Value in this Area
Purchase History
| Date | Buyer | Sale Price | Title Company |
|---|---|---|---|
| Hari Ryan Ernest | -- | Snap Title Agency | |
| Hari Jeffrey A | $225,000 | Great American Title Agency | |
| Charlene E Freitag Family Trust | -- | None Listed On Document | |
| Freitag Charlene E | -- | -- |
Source: Public Records
Mortgage History
| Date | Status | Borrower | Loan Amount |
|---|---|---|---|
| Open | Hari Ryan Ernest | $229,200 |
Source: Public Records
Tax History Compared to Growth
Tax History
| Year | Tax Paid | Tax Assessment Tax Assessment Total Assessment is a certain percentage of the fair market value that is determined by local assessors to be the total taxable value of land and additions on the property. | Land | Improvement |
|---|---|---|---|---|
| 2025 | $1,183 | $13,866 | -- | -- |
| 2024 | $1,194 | $13,205 | -- | -- |
| 2023 | $1,194 | $31,360 | $6,270 | $25,090 |
| 2022 | $1,161 | $23,450 | $4,690 | $18,760 |
| 2021 | $1,167 | $20,420 | $4,080 | $16,340 |
| 2020 | $1,154 | $18,550 | $3,710 | $14,840 |
| 2019 | $1,063 | $16,930 | $3,380 | $13,550 |
| 2018 | $1,032 | $15,210 | $3,040 | $12,170 |
| 2017 | $993 | $14,000 | $2,800 | $11,200 |
| 2016 | $971 | $13,050 | $2,610 | $10,440 |
| 2015 | $914 | $12,820 | $2,560 | $10,260 |
Source: Public Records
Map
Nearby Homes
- 1417 W Los Arboles Place
- 1403 W Los Arboles Place
- 2104 N Pennington Dr
- 1511 W Mesquite St
- 1913 N Verano Way
- 2201 N Comanche Dr Unit 1080
- 2201 N Comanche Dr Unit 1104
- 2201 N Comanche Dr Unit 1018
- 2201 N Comanche Dr Unit 1002
- 2129 N Villas Ln
- 1704 W Rosal Dr
- 2015 N Villas Ln
- 1224 W Mesquite St
- 1771 W Mariposa Ct
- 1214 W Estrella Dr
- 1645 N Saguaro St
- 1621 N Longmore St
- 1624 N Calle Cir
- 1714 N Pleasant Dr
- 812 W Rosal Place
- 1419 W El Monte Place
- 1423 W El Monte Place
- 1412 W Colt Rd
- 1410 W Colt Rd
- 1417 W El Monte Place
- 1425 W El Monte Place
- 1414 W Colt Rd
- 1408 W Colt Rd
- 1410 W El Monte Place
- 1414 W El Monte Place
- 1427 W El Monte Place
- 1416 W Colt Rd
- 1406 W Colt Rd
- 1415 W El Monte Place
- 1406 W El Monte Place Unit 14
- 1416 W El Monte Place
- 1418 W Colt Rd
- 1404 W Colt Rd
- 1413 W Colt Rd
- 1411 W Colt Rd