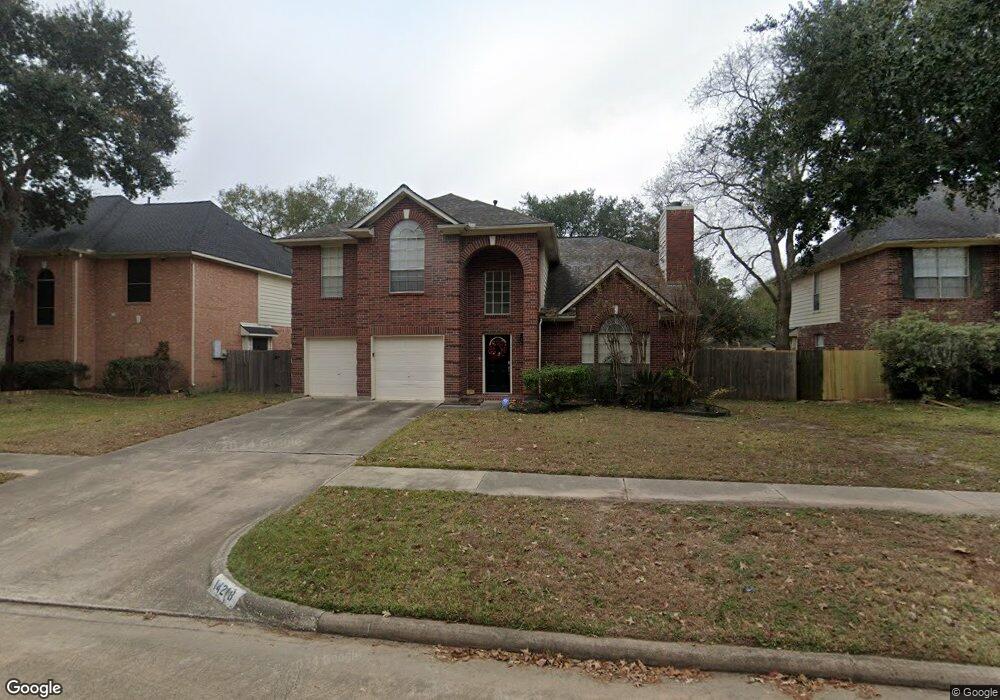
14218 Cypress Green Dr Cypress, TX 77429
Estimated Value: $335,529 - $368,000
4
Beds
3
Baths
2,639
Sq Ft
$134/Sq Ft
Est. Value
About This Home
This home is located at 14218 Cypress Green Dr, Cypress, TX 77429 and is currently estimated at $352,632, approximately $133 per square foot. 14218 Cypress Green Dr is a home located in Harris County with nearby schools including Black Elementary School, Hamilton Middle School, and Cy-Fair High School.
Ownership History
Date
Name
Owned For
Owner Type
Purchase Details
Closed on
Feb 26, 2014
Sold by
Srp Sub Llc
Bought by
Tarbert Llc
Current Estimated Value
Purchase Details
Closed on
Jun 14, 2013
Sold by
Boparai Dilbagh S and Kaur Gurinder
Bought by
Srp Sub Llc
Purchase Details
Closed on
May 30, 2006
Sold by
Maglitto David and Maglitto Theresa
Bought by
Boparai Dilbagh S
Home Financials for this Owner
Home Financials are based on the most recent Mortgage that was taken out on this home.
Original Mortgage
$29,880
Interest Rate
6.58%
Mortgage Type
Stand Alone Second
Purchase Details
Closed on
May 27, 1994
Sold by
Dover Homes Inc
Bought by
Tate Jon David and Tate Sandra D
Home Financials for this Owner
Home Financials are based on the most recent Mortgage that was taken out on this home.
Original Mortgage
$108,250
Interest Rate
5%
Create a Home Valuation Report for This Property
The Home Valuation Report is an in-depth analysis detailing your home's value as well as a comparison with similar homes in the area
Home Values in the Area
Average Home Value in this Area
Purchase History
| Date | Buyer | Sale Price | Title Company |
|---|---|---|---|
| Tarbert Llc | -- | -- | |
| Tarbert Llc | -- | -- | |
| Srp Sub Llc | -- | None Available | |
| Boparai Dilbagh S | -- | Stewart Title Houston Div | |
| Tate Jon David | -- | Commonwealth Land Title Co |
Source: Public Records
Mortgage History
| Date | Status | Borrower | Loan Amount |
|---|---|---|---|
| Previous Owner | Boparai Dilbagh S | $29,880 | |
| Previous Owner | Boparai Dilbagh S | $119,520 | |
| Previous Owner | Tate Jon David | $108,250 |
Source: Public Records
Tax History Compared to Growth
Tax History
| Year | Tax Paid | Tax Assessment Tax Assessment Total Assessment is a certain percentage of the fair market value that is determined by local assessors to be the total taxable value of land and additions on the property. | Land | Improvement |
|---|---|---|---|---|
| 2025 | $8,308 | $335,426 | $70,193 | $265,233 |
| 2024 | $8,308 | $317,718 | $70,193 | $247,525 |
| 2023 | $8,308 | $352,698 | $70,193 | $282,505 |
| 2022 | $8,462 | $305,564 | $58,433 | $247,131 |
| 2021 | $7,741 | $267,500 | $58,433 | $209,067 |
| 2020 | $6,531 | $218,471 | $44,100 | $174,371 |
| 2019 | $6,554 | $212,156 | $31,238 | $180,918 |
| 2018 | $2,896 | $201,141 | $31,238 | $169,903 |
| 2017 | $6,224 | $201,141 | $31,238 | $169,903 |
| 2016 | $6,143 | $198,500 | $31,238 | $167,262 |
| 2015 | $2,088 | $184,047 | $26,093 | $157,954 |
| 2014 | $2,088 | $158,684 | $26,093 | $132,591 |
Source: Public Records
Map
Nearby Homes
- 14039 Fairwood Breeze
- 14018 Fair Glade Ln
- 14418 Cypress Valley Dr
- 14426 Cypress Ridge Dr
- TBD Grant Rd
- 13718 Gainesway Dr
- 0 Grant Rd Unit 18392645
- 14522 Cypress Valley Dr
- 13907 Falling Rain Ct
- 14610 Cypress Green Dr
- 13910 Little Rock Ct
- 13614 Gainesway Dr
- 14102 Pawnee Bend Dr
- 13915 Springmint Dr
- 14626 Cypress Falls Dr
- 11627 Wilcant Ln
- 13119 Rosewood Glen Dr
- 13503 Copeland Oaks Blvd
- 13730 Brahman Valley Ct
- 14418 Louetta Rd
- 14222 Cypress Green Dr
- 14214 Cypress Green Dr
- 14226 Cypress Green Dr
- 14210 Cypress Green Dr
- 14219 Cypress Green Dr
- 14215 Cypress Green Dr
- 14223 Cypress Green Dr
- 14219 Cypress Ridge Dr
- 14223 Cypress Ridge Dr
- 14211 Cypress Green Dr
- 14227 Cypress Ridge Dr
- 14215 Cypress Ridge Dr
- 14227 Cypress Green Dr
- 14230 Cypress Green Dr
- 14206 Cypress Green Dr
- 14211 Cypress Ridge Dr
- 14231 Cypress Ridge Dr
- 14218 Cypress Falls Dr
- 14207 Cypress Green Dr
- 14214 Cypress Falls Dr