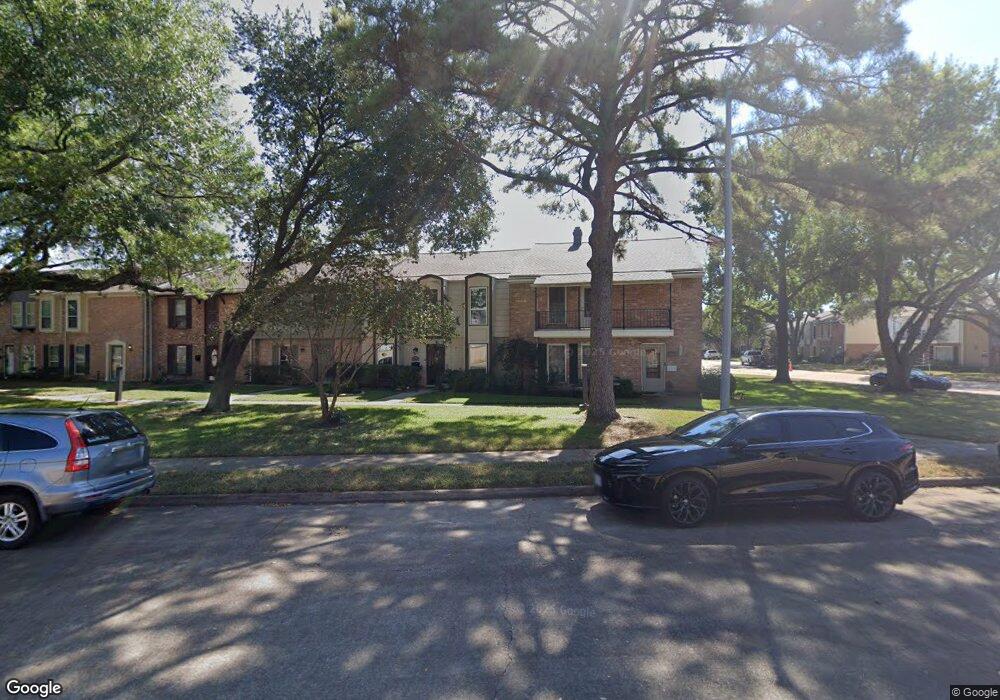
14219 Lost Meadow Ln Houston, TX 77079
Energy Corridor NeighborhoodEstimated Value: $281,000 - $311,000
3
Beds
3
Baths
2,464
Sq Ft
$120/Sq Ft
Est. Value
About This Home
This home is located at 14219 Lost Meadow Ln, Houston, TX 77079 and is currently estimated at $295,160, approximately $119 per square foot. 14219 Lost Meadow Ln is a home located in Harris County with nearby schools including Thornwood Elementary School, Spring Forest Middle School, and Stratford High School.
Ownership History
Date
Name
Owned For
Owner Type
Purchase Details
Closed on
Jun 16, 2016
Sold by
Hubbard Cook Rosa Maggi and Dittrich Rosa M
Bought by
Yaghmai Zahrashabnam and Taheri Majid
Current Estimated Value
Home Financials for this Owner
Home Financials are based on the most recent Mortgage that was taken out on this home.
Original Mortgage
$189,000
Outstanding Balance
$150,619
Interest Rate
3.61%
Mortgage Type
New Conventional
Estimated Equity
$144,541
Purchase Details
Closed on
Jul 19, 2006
Sold by
Allebach Anna Marie
Bought by
Dittrich Rosa M
Purchase Details
Closed on
Jul 27, 2001
Sold by
Rosenbaum Charles Henry
Bought by
Allebach Anna M
Purchase Details
Closed on
Nov 25, 1998
Sold by
Newell Paul J and Newell Mariann
Bought by
Allebach Anna Marie
Purchase Details
Closed on
Oct 31, 1996
Sold by
Tiller Henry Grady and Tiller Patricia Thompson
Bought by
Allebach Anna Marie
Create a Home Valuation Report for This Property
The Home Valuation Report is an in-depth analysis detailing your home's value as well as a comparison with similar homes in the area
Home Values in the Area
Average Home Value in this Area
Purchase History
| Date | Buyer | Sale Price | Title Company |
|---|---|---|---|
| Yaghmai Zahrashabnam | -- | Great American Title | |
| Dittrich Rosa M | -- | Alamo Title Company | |
| Allebach Anna M | -- | -- | |
| Allebach Anna Marie | -- | Chicago Title | |
| Allebach Anna Marie | -- | -- |
Source: Public Records
Mortgage History
| Date | Status | Borrower | Loan Amount |
|---|---|---|---|
| Open | Yaghmai Zahrashabnam | $189,000 |
Source: Public Records
Tax History Compared to Growth
Tax History
| Year | Tax Paid | Tax Assessment Tax Assessment Total Assessment is a certain percentage of the fair market value that is determined by local assessors to be the total taxable value of land and additions on the property. | Land | Improvement |
|---|---|---|---|---|
| 2025 | $4,130 | $296,928 | $65,975 | $230,953 |
| 2024 | $4,130 | $309,378 | $65,975 | $243,403 |
| 2023 | $4,130 | $318,170 | $65,975 | $252,195 |
| 2022 | $6,223 | $243,991 | $65,975 | $178,016 |
| 2021 | $5,919 | $242,444 | $65,975 | $176,469 |
| 2020 | $5,763 | $230,000 | $65,975 | $164,025 |
| 2019 | $6,048 | $238,000 | $51,314 | $186,686 |
| 2018 | $2,055 | $210,000 | $51,314 | $158,686 |
| 2017 | $5,494 | $210,000 | $51,314 | $158,686 |
| 2016 | $4,990 | $190,746 | $36,653 | $154,093 |
| 2015 | $4,264 | $190,746 | $36,653 | $154,093 |
| 2014 | $4,264 | $160,192 | $29,322 | $130,870 |
Source: Public Records
Map
Nearby Homes
- 14213 Lost Meadow Ln
- 14151 Lost Meadow Ln
- 14325 Lost Meadow Ln
- 14143 Lost Meadow Ln
- 14228 Misty Meadow Ln
- 14226 Misty Meadow Ln
- 1334 Country Place Dr
- 14322 Misty Meadow Ln
- 1310 Country Place Dr
- 14407 Still Meadow Dr
- 14123 Misty Meadow Ln
- 14171 Misty Meadow Ln
- 14311 Misty Meadow Ln
- 1381 Country Place Dr Unit 23
- 14387 Misty Meadow Ln
- 14122 Barryknoll Ln
- 1147 Country Place Dr
- 14435 Misty Meadow Ln
- 1071 Country Place Dr Unit 1071
- 14507 Misty Meadow Ln
- 14217 Lost Meadow Ln
- 14221 Lost Meadow Ln
- 14215 Lost Meadow Ln
- 14211 Lost Meadow Ln
- 14209 Lost Meadow Ln
- 14225 Lost Meadow Ln
- 14223 Lost Meadow Ln
- 14227 Lost Meadow Ln
- 14229 Lost Meadow Ln
- 14231 Lost Meadow Ln
- 14207 Lost Meadow Ln
- 14305 Lost Meadow Ln
- 14307 Lost Meadow Ln
- 14303 Lost Meadow Ln
- 14309 Lost Meadow Ln
- 14233 Lost Meadow Ln
- 14205 Lost Meadow Ln
- 14313 Lost Meadow Ln
- 14315 Lost Meadow Ln
- 14271 Lost Meadow Ln