Estimated Value: $298,599 - $350,000
3
Beds
2
Baths
1,127
Sq Ft
$289/Sq Ft
Est. Value
About This Home
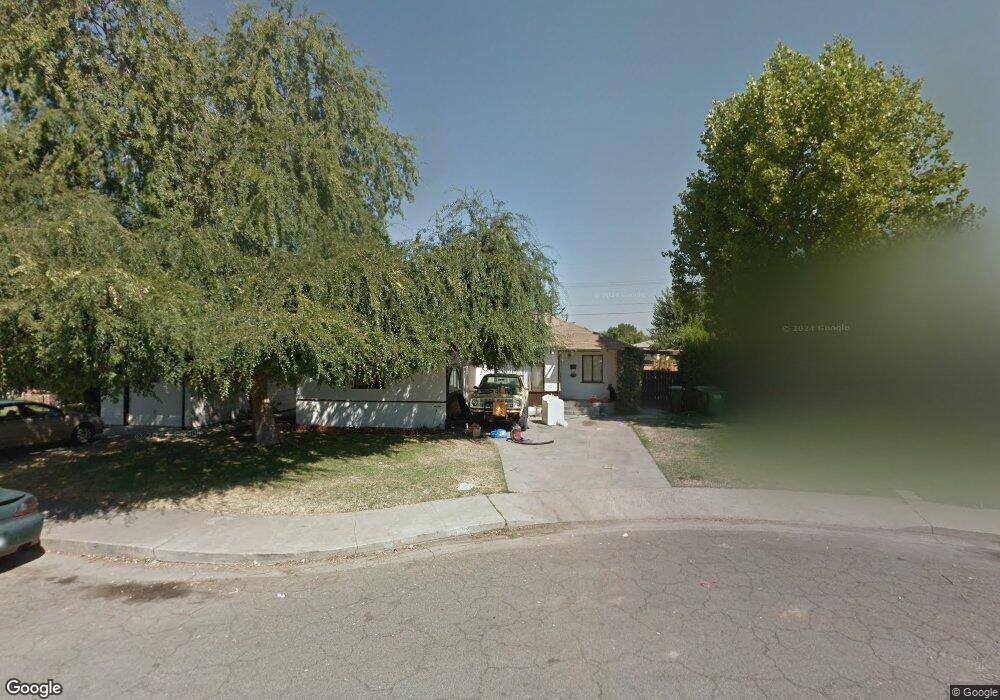
This home is located at 1422 Gary St, Selma, CA 93662 and is currently estimated at $325,400, approximately $288 per square foot. 1422 Gary St is a home located in Fresno County with nearby schools including Theodore Roosevelt Elementary School, Abraham Lincoln Middle School, and Selma High School.
Ownership History
Date
Name
Owned For
Owner Type
Purchase Details
Closed on
Feb 8, 2018
Sold by
Baze Vena Denise
Bought by
Brooks Rodney A
Current Estimated Value
Home Financials for this Owner
Home Financials are based on the most recent Mortgage that was taken out on this home.
Original Mortgage
$98,062
Interest Rate
4.4%
Mortgage Type
New Conventional
Purchase Details
Closed on
Feb 24, 2005
Sold by
Baze Mike Duane
Bought by
Baze Vena Denise
Purchase Details
Closed on
Feb 7, 2005
Sold by
Rudolfs Boris G and Rudolfs April D
Bought by
Baze Vena Denise
Create a Home Valuation Report for This Property
The Home Valuation Report is an in-depth analysis detailing your home's value as well as a comparison with similar homes in the area
Home Values in the Area
Average Home Value in this Area
Purchase History
| Date | Buyer | Sale Price | Title Company |
|---|---|---|---|
| Brooks Rodney A | $95,000 | Chicago Title Company | |
| Baze Vena Denise | -- | Financial Title Company | |
| Baze Vena Denise | $75,000 | Financial Title Company |
Source: Public Records
Mortgage History
| Date | Status | Borrower | Loan Amount |
|---|---|---|---|
| Previous Owner | Brooks Rodney A | $98,062 |
Source: Public Records
Tax History
| Year | Tax Paid | Tax Assessment Tax Assessment Total Assessment is a certain percentage of the fair market value that is determined by local assessors to be the total taxable value of land and additions on the property. | Land | Improvement |
|---|---|---|---|---|
| 2025 | $2,764 | $147,913 | $68,267 | $79,646 |
| 2023 | $2,234 | $142,171 | $65,617 | $76,554 |
| 2022 | $2,544 | $139,384 | $64,331 | $75,053 |
| 2021 | $2,481 | $136,652 | $63,070 | $73,582 |
| 2020 | $2,451 | $135,252 | $62,424 | $72,828 |
| 2019 | $2,383 | $132,600 | $61,200 | $71,400 |
| 2018 | $2,334 | $137,700 | $61,200 | $76,500 |
| 2017 | $3,563 | $135,000 | $60,000 | $75,000 |
| 2016 | $1,907 | $120,000 | $50,000 | $70,000 |
| 2015 | $2,007 | $125,000 | $35,000 | $90,000 |
| 2014 | $1,519 | $83,900 | $36,800 | $47,100 |
Source: Public Records
Map
Nearby Homes
- 2980 Olive St
- 2841 C St
- 2850 Mccall Ave Unit A-F
- 1405 Huntsman Ave
- 1517 Stillman St
- 2019 Oak St
- 2020 Aspen St
- 12623 S Mccall Ave
- 2002 Merced St
- 3280 Mccall Ave
- 2482 Country Club Ln
- 2629 Mccall Ave
- 3502 Dockery Ave
- 3506 Mulberry St
- 3239 Lee St
- 3510 Woodrow St
- 2221 Floral Ave
- 1233 Redwood Ln
- 2232 Gaither St
- 1245 Northhill St
Your Personal Tour Guide
Ask me questions while you tour the home.