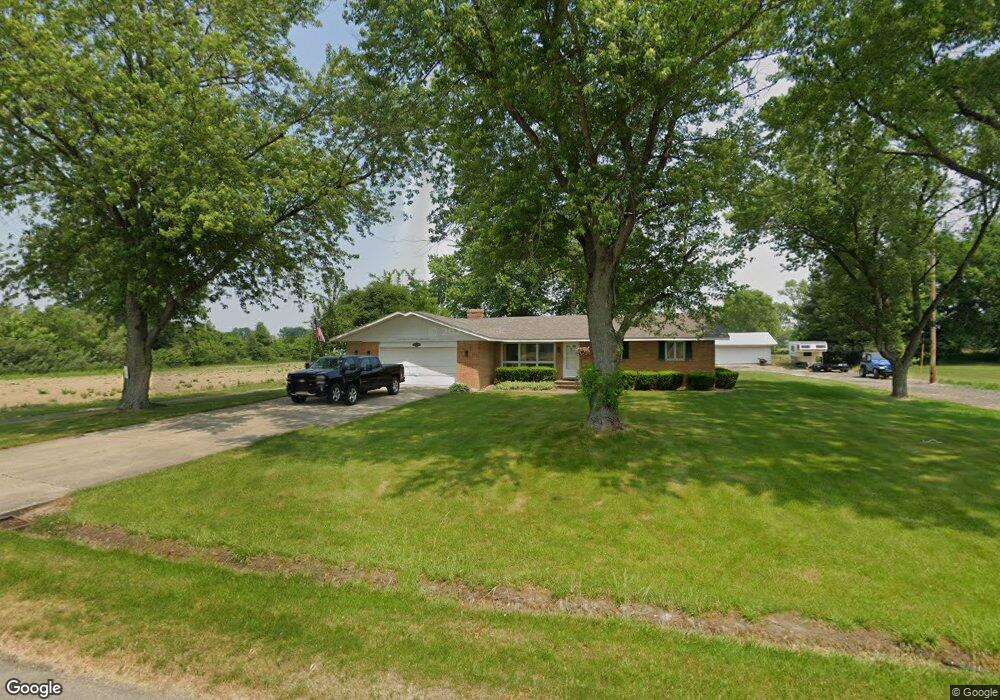
1422 N Queen Rd Walkerton, IN 46574
Estimated Value: $296,000 - $391,000
2
Beds
2
Baths
1,746
Sq Ft
$203/Sq Ft
Est. Value
About This Home
This home is located at 1422 N Queen Rd, Walkerton, IN 46574 and is currently estimated at $354,289, approximately $202 per square foot. 1422 N Queen Rd is a home located in Marshall County with nearby schools including John Glenn High School.
Ownership History
Date
Name
Owned For
Owner Type
Purchase Details
Closed on
Jun 24, 2014
Sold by
Kerckhove Maurice J and Kerckhove Patricia J
Bought by
Niespodziany Robert
Current Estimated Value
Home Financials for this Owner
Home Financials are based on the most recent Mortgage that was taken out on this home.
Original Mortgage
$164,109
Outstanding Balance
$126,219
Interest Rate
4.5%
Mortgage Type
FHA
Estimated Equity
$228,070
Purchase Details
Closed on
Dec 10, 2001
Sold by
Dare Clark H and Dare Mary E
Bought by
Kerckhove Maurice and Kerckhove Jr
Create a Home Valuation Report for This Property
The Home Valuation Report is an in-depth analysis detailing your home's value as well as a comparison with similar homes in the area
Home Values in the Area
Average Home Value in this Area
Purchase History
| Date | Buyer | Sale Price | Title Company |
|---|---|---|---|
| Niespodziany Robert | -- | Freibert & Mattingly Title G | |
| Kerckhove Maurice | -- | -- |
Source: Public Records
Mortgage History
| Date | Status | Borrower | Loan Amount |
|---|---|---|---|
| Open | Niespodziany Robert | $164,109 |
Source: Public Records
Tax History Compared to Growth
Tax History
| Year | Tax Paid | Tax Assessment Tax Assessment Total Assessment is a certain percentage of the fair market value that is determined by local assessors to be the total taxable value of land and additions on the property. | Land | Improvement |
|---|---|---|---|---|
| 2024 | $1,875 | $272,500 | $63,200 | $209,300 |
| 2022 | $1,875 | $229,200 | $46,500 | $182,700 |
| 2021 | $1,423 | $167,500 | $39,200 | $128,300 |
| 2020 | $1,214 | $153,400 | $36,500 | $116,900 |
| 2019 | $1,168 | $149,700 | $37,800 | $111,900 |
| 2018 | $1,188 | $146,100 | $37,400 | $108,700 |
| 2017 | $1,014 | $139,500 | $38,700 | $100,800 |
| 2016 | $1,017 | $148,100 | $39,500 | $108,600 |
| 2014 | $1,044 | $151,700 | $40,700 | $111,000 |
Source: Public Records
Map
Nearby Homes