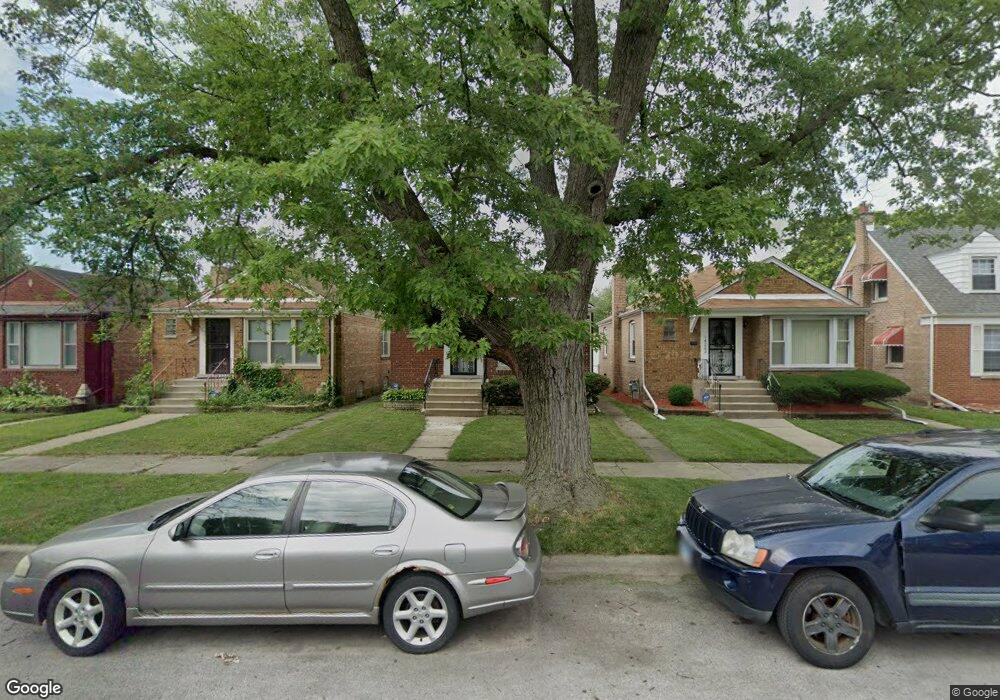
14224 S Michigan Ave Riverdale, IL 60827
Estimated Value: $127,084 - $172,000
2
Beds
1
Bath
893
Sq Ft
$157/Sq Ft
Est. Value
About This Home
This home is located at 14224 S Michigan Ave, Riverdale, IL 60827 and is currently estimated at $140,521, approximately $157 per square foot. 14224 S Michigan Ave is a home located in Cook County with nearby schools including Park Elementary School, Roosevelt Junior High School, and Thornton Township High School.
Ownership History
Date
Name
Owned For
Owner Type
Purchase Details
Closed on
Jun 13, 2005
Sold by
Penn Chase
Bought by
Walker Rodney
Current Estimated Value
Home Financials for this Owner
Home Financials are based on the most recent Mortgage that was taken out on this home.
Original Mortgage
$75,200
Outstanding Balance
$39,838
Interest Rate
5.99%
Mortgage Type
Unknown
Estimated Equity
$100,683
Purchase Details
Closed on
Jan 19, 2005
Sold by
Walker Keith
Bought by
Penn Chase
Home Financials for this Owner
Home Financials are based on the most recent Mortgage that was taken out on this home.
Original Mortgage
$61,425
Interest Rate
5.83%
Mortgage Type
Unknown
Purchase Details
Closed on
Aug 21, 2001
Sold by
Hud
Bought by
Walker Keith
Home Financials for this Owner
Home Financials are based on the most recent Mortgage that was taken out on this home.
Original Mortgage
$57,475
Interest Rate
9.75%
Create a Home Valuation Report for This Property
The Home Valuation Report is an in-depth analysis detailing your home's value as well as a comparison with similar homes in the area
Home Values in the Area
Average Home Value in this Area
Purchase History
| Date | Buyer | Sale Price | Title Company |
|---|---|---|---|
| Walker Rodney | $94,000 | Stewart Title Of Illinois | |
| Penn Chase | $68,500 | Stewart Title Guaranty Compa | |
| Walker Keith | -- | Stewart Title |
Source: Public Records
Mortgage History
| Date | Status | Borrower | Loan Amount |
|---|---|---|---|
| Open | Walker Rodney | $75,200 | |
| Previous Owner | Penn Chase | $61,425 | |
| Previous Owner | Walker Keith | $57,475 |
Source: Public Records
Tax History Compared to Growth
Tax History
| Year | Tax Paid | Tax Assessment Tax Assessment Total Assessment is a certain percentage of the fair market value that is determined by local assessors to be the total taxable value of land and additions on the property. | Land | Improvement |
|---|---|---|---|---|
| 2024 | $4,380 | $9,000 | $1,594 | $7,406 |
| 2023 | $2,087 | $9,000 | $1,594 | $7,406 |
| 2022 | $2,087 | $5,585 | $1,406 | $4,179 |
| 2021 | $2,123 | $5,584 | $1,406 | $4,178 |
| 2020 | $2,225 | $5,584 | $1,406 | $4,178 |
| 2019 | $2,884 | $6,488 | $1,312 | $5,176 |
| 2018 | $2,755 | $6,488 | $1,312 | $5,176 |
| 2017 | $2,684 | $6,488 | $1,312 | $5,176 |
| 2016 | $3,192 | $6,458 | $1,218 | $5,240 |
| 2015 | $3,021 | $6,458 | $1,218 | $5,240 |
| 2014 | $3,019 | $6,458 | $1,218 | $5,240 |
| 2013 | $3,170 | $7,040 | $1,218 | $5,822 |
Source: Public Records
Map
Nearby Homes
- 14216 S Michigan Ave
- 14202 S Michigan Ave
- 14308 S Michigan Ave
- 14309 S Wabash Ave
- 14214 S State St Unit 3
- 14115 S Wabash Ave
- 14231 S Dearborn St
- 14116 S Wabash Ave
- 14213 S Dearborn St
- 14132 S State St
- 212 E 142nd Place
- 14129 S Dearborn St
- 62 E 144th St
- 14114 S State St
- 14312 S Dearborn St
- 8 E 144th St Unit 5
- 25 E 141st St
- 14311 S Clark St
- 14114 S Dearborn St
- 3 W 141st St
- 14226 S Michigan Ave
- 14222 S Michigan Ave Unit 3
- 14228 S Michigan Ave
- 14220 S Michigan Ave
- 14230 S Michigan Ave
- 14225 S Wabash Ave
- 14223 S Wabash Ave
- 14234 S Michigan Ave
- 14227 S Wabash Ave
- 14221 S Wabash Ave
- 14214 S Michigan Ave
- 14219 S Wabash Ave
- 14231 S Wabash Ave
- 14231 S Wabash Ave
- 14235 S Wabash Ave
- 14235 S Wabash Ave
- 14217 S Wabash Ave
- 14219 S Michigan Ave
- 14217 S Michigan Ave