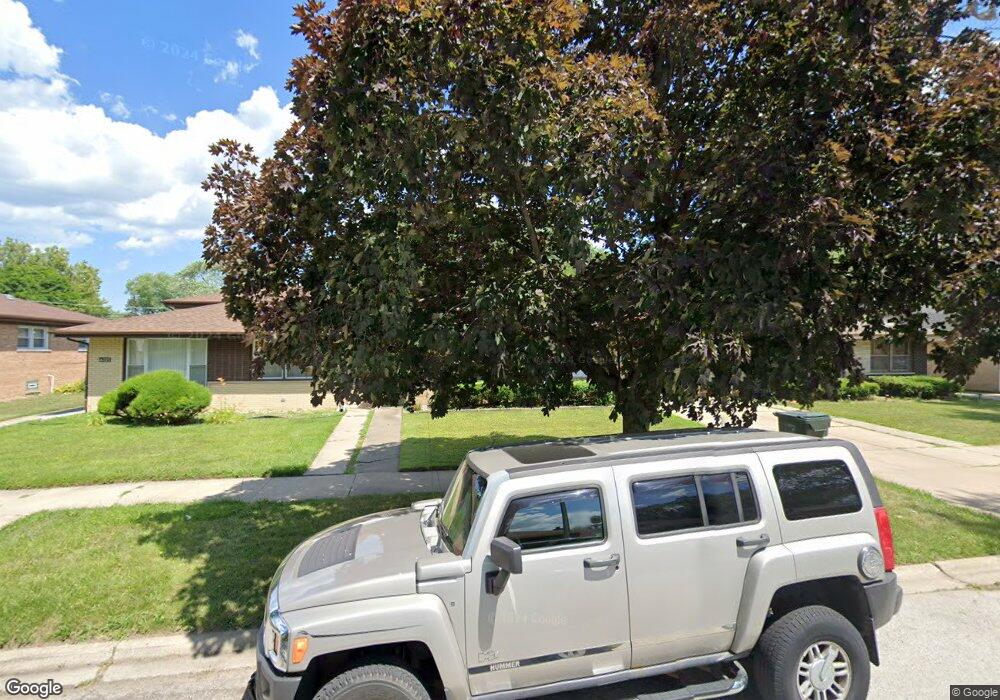
14229 Maryland Ave Dolton, IL 60419
Estimated Value: $158,645 - $215,000
3
Beds
2
Baths
1,229
Sq Ft
$150/Sq Ft
Est. Value
About This Home
This home is located at 14229 Maryland Ave, Dolton, IL 60419 and is currently estimated at $184,911, approximately $150 per square foot. 14229 Maryland Ave is a home located in Cook County with nearby schools including Lincoln Elementary School, Lincoln Junior High School, and Thornridge High School.
Ownership History
Date
Name
Owned For
Owner Type
Purchase Details
Closed on
Oct 15, 2009
Sold by
Karim Khalid
Bought by
Payton Angela M
Current Estimated Value
Home Financials for this Owner
Home Financials are based on the most recent Mortgage that was taken out on this home.
Original Mortgage
$106,043
Interest Rate
5.05%
Mortgage Type
FHA
Purchase Details
Closed on
Nov 16, 2007
Sold by
Equicredit Corp Of America
Bought by
Karim Khalid
Purchase Details
Closed on
Jun 19, 2007
Sold by
Hogan James H
Bought by
Equicredit Corp Of America
Purchase Details
Closed on
Jan 23, 2001
Sold by
Hogan Genell
Bought by
Hogan James H and Hogan Genell
Home Financials for this Owner
Home Financials are based on the most recent Mortgage that was taken out on this home.
Original Mortgage
$113,400
Interest Rate
7.18%
Create a Home Valuation Report for This Property
The Home Valuation Report is an in-depth analysis detailing your home's value as well as a comparison with similar homes in the area
Home Values in the Area
Average Home Value in this Area
Purchase History
| Date | Buyer | Sale Price | Title Company |
|---|---|---|---|
| Payton Angela M | $108,000 | First American | |
| Karim Khalid | $110,000 | Ticor | |
| Equicredit Corp Of America | -- | Ticor | |
| Hogan James H | -- | -- |
Source: Public Records
Mortgage History
| Date | Status | Borrower | Loan Amount |
|---|---|---|---|
| Previous Owner | Payton Angela M | $106,043 | |
| Previous Owner | Hogan James H | $113,400 |
Source: Public Records
Tax History Compared to Growth
Tax History
| Year | Tax Paid | Tax Assessment Tax Assessment Total Assessment is a certain percentage of the fair market value that is determined by local assessors to be the total taxable value of land and additions on the property. | Land | Improvement |
|---|---|---|---|---|
| 2024 | $7,686 | $15,000 | $2,108 | $12,892 |
| 2023 | $7,110 | $15,000 | $2,108 | $12,892 |
| 2022 | $7,110 | $11,803 | $1,860 | $9,943 |
| 2021 | $7,101 | $11,802 | $1,860 | $9,942 |
| 2020 | $6,891 | $11,802 | $1,860 | $9,942 |
| 2019 | $5,193 | $9,354 | $1,736 | $7,618 |
| 2018 | $5,032 | $9,354 | $1,736 | $7,618 |
| 2017 | $4,785 | $9,354 | $1,736 | $7,618 |
| 2016 | $5,762 | $10,356 | $1,612 | $8,744 |
| 2015 | $5,496 | $10,356 | $1,612 | $8,744 |
| 2014 | $5,492 | $10,356 | $1,612 | $8,744 |
| 2013 | $5,632 | $11,316 | $1,612 | $9,704 |
Source: Public Records
Map
Nearby Homes
- 14333 Drexel Ave
- 14221 Ingleside Ave
- 14325 Ingleside Ave
- 933 E 142nd St
- 14400 Shepard Dr
- 14418 Drexel Ave
- 14320 Dobson Ave
- 1011 E 142nd St
- 14408 Lincoln Ave
- 14234 Minerva Ave
- 14214 Minerva Ave
- 14237 Minerva Ave
- 14508 Ingleside Ave
- 14421 Murray Ave
- 14263 Lincoln Ave
- 14223 University Ave
- 14429 Minerva Ave
- 14526 Cottage Grove Ave
- 14238 Woodlawn Ave
- 14411 Irving Ave
- 14227 Maryland Ave
- 14233 Maryland Ave
- 14225 Maryland Ave
- 14235 Maryland Ave
- 14221 Maryland Ave
- 14239 Maryland Ave
- 14228 Drexel Ave
- 14232 Drexel Ave
- 14226 Drexel Ave
- 14217 Maryland Ave
- 14234 Drexel Ave
- 14243 Maryland Ave
- 14224 Drexel Ave
- 14220 Drexel Ave
- 14238 Drexel Ave
- 14228 Maryland Ave
- 14226 Maryland Ave
- 14232 Maryland Ave
- 14245 Maryland Ave
- 14213 Maryland Ave