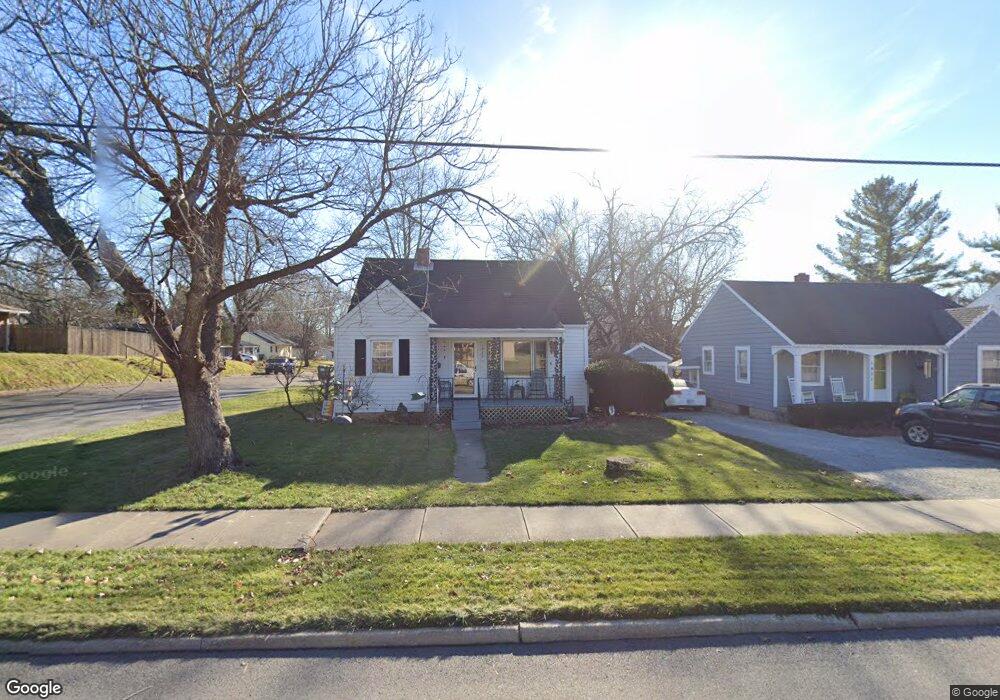
1423 E 8th St Anderson, IN 46012
Estimated Value: $114,000 - $170,000
2
Beds
1
Bath
1,516
Sq Ft
$96/Sq Ft
Est. Value
About This Home
This home is located at 1423 E 8th St, Anderson, IN 46012 and is currently estimated at $145,152, approximately $95 per square foot. 1423 E 8th St is a home located in Madison County with nearby schools including Tenth Street Elementary School, Highland Middle School, and Anderson High School.
Ownership History
Date
Name
Owned For
Owner Type
Purchase Details
Closed on
Jul 1, 2019
Sold by
Goode Susan
Bought by
Foltz Julie
Current Estimated Value
Home Financials for this Owner
Home Financials are based on the most recent Mortgage that was taken out on this home.
Original Mortgage
$59,562
Outstanding Balance
$52,312
Interest Rate
4.25%
Mortgage Type
FHA
Estimated Equity
$92,840
Purchase Details
Closed on
Feb 16, 2007
Sold by
Jameson Susan C
Bought by
Foltz Julie A
Create a Home Valuation Report for This Property
The Home Valuation Report is an in-depth analysis detailing your home's value as well as a comparison with similar homes in the area
Home Values in the Area
Average Home Value in this Area
Purchase History
| Date | Buyer | Sale Price | Title Company |
|---|---|---|---|
| Foltz Julie | -- | None Available | |
| Foltz Julie A | -- | -- |
Source: Public Records
Mortgage History
| Date | Status | Borrower | Loan Amount |
|---|---|---|---|
| Open | Foltz Julie | $59,562 |
Source: Public Records
Tax History
| Year | Tax Paid | Tax Assessment Tax Assessment Total Assessment is a certain percentage of the fair market value that is determined by local assessors to be the total taxable value of land and additions on the property. | Land | Improvement |
|---|---|---|---|---|
| 2025 | $791 | $82,200 | $13,400 | $68,800 |
| 2024 | $791 | $74,900 | $13,400 | $61,500 |
| 2023 | $723 | $68,400 | $12,700 | $55,700 |
| 2022 | $689 | $69,100 | $12,200 | $56,900 |
| 2021 | $678 | $64,600 | $12,100 | $52,500 |
| 2020 | $640 | $61,500 | $11,500 | $50,000 |
| 2019 | $631 | $60,100 | $11,500 | $48,600 |
| 2018 | $592 | $55,700 | $11,500 | $44,200 |
| 2017 | $549 | $55,600 | $11,500 | $44,100 |
| 2016 | $538 | $55,600 | $11,500 | $44,100 |
| 2014 | $459 | $52,300 | $10,800 | $41,500 |
| 2013 | $459 | $52,300 | $10,800 | $41,500 |
Source: Public Records
Map
Nearby Homes
- 1302 E 8th St
- 1300 E 7th St
- 1803 E 10th St
- 812 Chestnut St
- 914 Chestnut St
- 1111 E 7th St
- 1518 Martin Dr
- 1207 E 11th St
- 809 College Dr
- 908 Cottage Ave
- 0 University Blvd
- 803 Cottage Ave
- 710 E 6th St
- 225 College Dr
- 2328 E 9th St
- 307 Cottage Ave
- 1625 B St Unit 18
- 1625 B St Unit 26
- 1625 B St Unit 44
- 830 Chester St
Your Personal Tour Guide
Ask me questions while you tour the home.