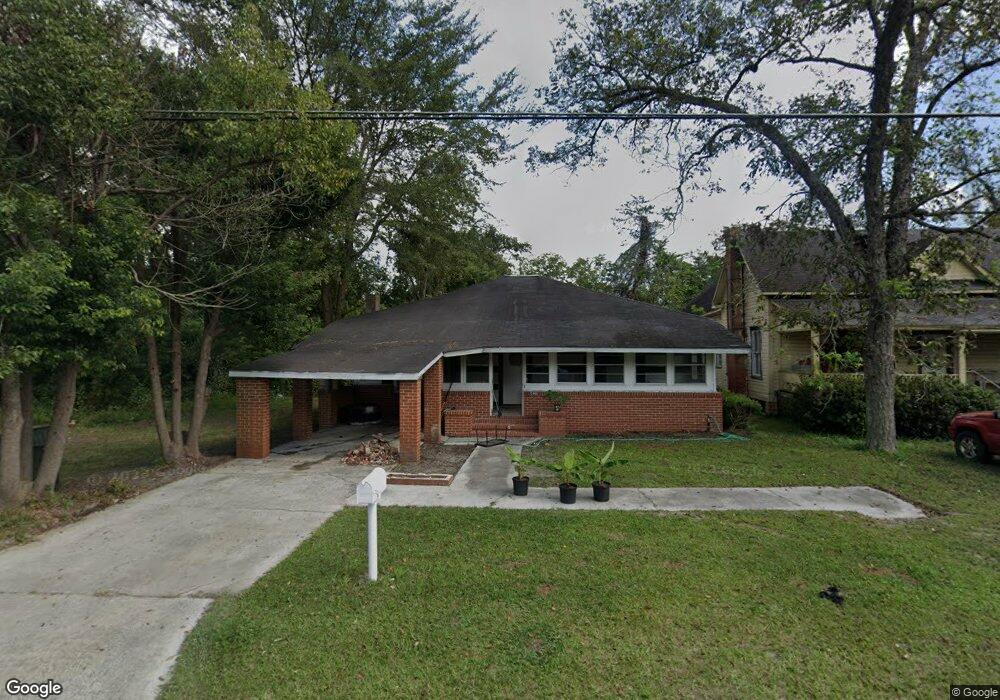
1423 Gilmore St Waycross, GA 31501
Estimated Value: $77,000 - $124,141
3
Beds
1
Bath
1,461
Sq Ft
$72/Sq Ft
Est. Value
About This Home
This home is located at 1423 Gilmore St, Waycross, GA 31501 and is currently estimated at $104,785, approximately $71 per square foot. 1423 Gilmore St is a home located in Ware County with nearby schools including Ruskin Elementary School, Ware County Middle School, and Ware County High School.
Ownership History
Date
Name
Owned For
Owner Type
Purchase Details
Closed on
Apr 10, 2015
Sold by
Collins Roger E
Bought by
Collins Pamela J
Current Estimated Value
Purchase Details
Closed on
Mar 2, 2009
Sold by
Todd Dale O
Bought by
Collins Roger E and Collins Pamela J
Home Financials for this Owner
Home Financials are based on the most recent Mortgage that was taken out on this home.
Original Mortgage
$34,350
Interest Rate
6.5%
Mortgage Type
Future Advance Clause Open End Mortgage
Purchase Details
Closed on
Jun 15, 2004
Sold by
The Bank Of New York Nc 04-11-05 Ldr
Bought by
Todd Dale
Purchase Details
Closed on
May 4, 2004
Sold by
Mccoy Clyde and Mccoy Elizab
Bought by
The Bank Of New York
Purchase Details
Closed on
Oct 19, 1999
Sold by
Rothwell Marianne H
Bought by
Mccoy Clyde and Mccoy Elizab
Purchase Details
Closed on
Feb 20, 1998
Sold by
Byrd W E
Bought by
Rothwell Marianne H
Create a Home Valuation Report for This Property
The Home Valuation Report is an in-depth analysis detailing your home's value as well as a comparison with similar homes in the area
Home Values in the Area
Average Home Value in this Area
Purchase History
| Date | Buyer | Sale Price | Title Company |
|---|---|---|---|
| Collins Pamela J | -- | -- | |
| Collins Roger E | $33,750 | -- | |
| Todd Dale | $16,200 | -- | |
| The Bank Of New York | -- | -- | |
| Mccoy Clyde | $33,600 | -- | |
| Rothwell Marianne H | $48,500 | -- |
Source: Public Records
Mortgage History
| Date | Status | Borrower | Loan Amount |
|---|---|---|---|
| Previous Owner | Collins Roger E | $34,350 |
Source: Public Records
Tax History Compared to Growth
Tax History
| Year | Tax Paid | Tax Assessment Tax Assessment Total Assessment is a certain percentage of the fair market value that is determined by local assessors to be the total taxable value of land and additions on the property. | Land | Improvement |
|---|---|---|---|---|
| 2024 | $1,060 | $36,064 | $1,476 | $34,588 |
| 2023 | $1,244 | $26,789 | $717 | $26,072 |
| 2022 | $1,068 | $26,789 | $717 | $26,072 |
| 2021 | $876 | $20,268 | $717 | $19,551 |
| 2020 | $869 | $19,950 | $717 | $19,233 |
| 2019 | $826 | $18,680 | $717 | $17,963 |
| 2018 | $798 | $17,887 | $717 | $17,170 |
| 2017 | $780 | $17,887 | $717 | $17,170 |
| 2016 | $780 | $17,887 | $717 | $17,170 |
| 2015 | $785 | $17,886 | $717 | $17,170 |
| 2014 | $784 | $17,886 | $717 | $17,170 |
| 2013 | -- | $17,886 | $716 | $17,169 |
Source: Public Records
Map
Nearby Homes
- 1304 Brunel St
- 201 Washington Ave
- 1808 Brunel St
- 1021 Lee Ave
- 0 Cabinet St
- 615 Morton Ave
- 805 Brunel St
- 705 Gilmore St
- 2204 & 2210 Gibbs St
- 306 Lee Ave
- 418 Reed St
- 0 Marion St
- 1500 Georgia Ave
- 1103 Ann St
- 0 Kentucky Ave
- 1125 Georgia St
- 803 Elizabeth St
- 924 Highsmith St
- 1208 Margaret St
- 506 McDonald St
- 1425 Gilmore St
- 109 E Hamilton Ave
- 1501 Gilmore St
- 308 Wallace St
- 1426 Gilmore St
- 1503 Gilmore St
- 108 E Hamilton Ave
- 1502 Gilmore St
- 1418 Gilmore St
- 1507 Gilmore St
- 1507 Lee Ave
- 207 E Hamilton Ave
- 1504 Gilmore St
- 1453 Brunel St
- 1449 Brunel St
- 1603 Gilmore St
- 1416 Gilmore St
- 202 Fireman St
- 1605 Osceola Ave
- 1441 Brunel St