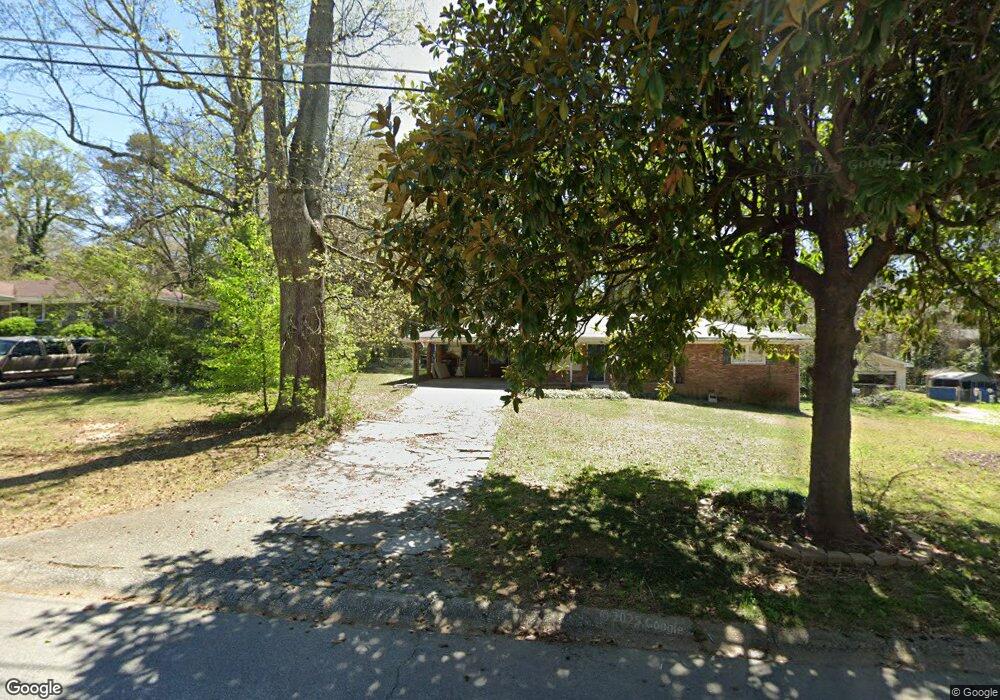
1423 Marlene Ln SW Mableton, GA 30126
Estimated Value: $249,911 - $277,000
3
Beds
2
Baths
1,237
Sq Ft
$209/Sq Ft
Est. Value
About This Home
This home is located at 1423 Marlene Ln SW, Mableton, GA 30126 and is currently estimated at $258,228, approximately $208 per square foot. 1423 Marlene Ln SW is a home located in Cobb County with nearby schools including Mableton Elementary School, Garrett Middle School, and Pebblebrook High School.
Ownership History
Date
Name
Owned For
Owner Type
Purchase Details
Closed on
Jan 20, 2005
Sold by
Peymax Properties Inc
Bought by
Robbins Ian
Current Estimated Value
Home Financials for this Owner
Home Financials are based on the most recent Mortgage that was taken out on this home.
Original Mortgage
$91,827
Interest Rate
5.57%
Purchase Details
Closed on
Nov 24, 2004
Sold by
Pannell Daryn and Pannell Monica
Bought by
Peymax Properties Inc
Home Financials for this Owner
Home Financials are based on the most recent Mortgage that was taken out on this home.
Original Mortgage
$91,827
Interest Rate
5.57%
Purchase Details
Closed on
Aug 25, 1994
Sold by
Jent Mrs Geraldine
Bought by
Pannell Daryn L
Home Financials for this Owner
Home Financials are based on the most recent Mortgage that was taken out on this home.
Original Mortgage
$61,950
Interest Rate
8.44%
Mortgage Type
FHA
Create a Home Valuation Report for This Property
The Home Valuation Report is an in-depth analysis detailing your home's value as well as a comparison with similar homes in the area
Home Values in the Area
Average Home Value in this Area
Purchase History
| Date | Buyer | Sale Price | Title Company |
|---|---|---|---|
| Robbins Ian | $92,900 | -- | |
| Peymax Properties Inc | $70,000 | -- | |
| Pannell Daryn L | $62,900 | -- |
Source: Public Records
Mortgage History
| Date | Status | Borrower | Loan Amount |
|---|---|---|---|
| Previous Owner | Peymax Properties Inc | $91,827 | |
| Previous Owner | Pannell Daryn L | $61,950 |
Source: Public Records
Tax History Compared to Growth
Tax History
| Year | Tax Paid | Tax Assessment Tax Assessment Total Assessment is a certain percentage of the fair market value that is determined by local assessors to be the total taxable value of land and additions on the property. | Land | Improvement |
|---|---|---|---|---|
| 2025 | $2,618 | $86,896 | $18,000 | $68,896 |
| 2024 | $2,620 | $86,896 | $18,000 | $68,896 |
| 2023 | $2,620 | $86,896 | $18,000 | $68,896 |
| 2022 | $2,193 | $72,272 | $16,000 | $56,272 |
| 2021 | $1,593 | $52,472 | $12,000 | $40,472 |
| 2020 | $1,593 | $52,472 | $12,000 | $40,472 |
| 2019 | $1,409 | $46,412 | $12,000 | $34,412 |
| 2018 | $1,144 | $37,696 | $11,200 | $26,496 |
| 2017 | $1,084 | $37,696 | $11,200 | $26,496 |
| 2016 | $648 | $22,548 | $4,000 | $18,548 |
| 2015 | $664 | $22,548 | $4,000 | $18,548 |
| 2014 | $558 | $18,792 | $0 | $0 |
Source: Public Records
Map
Nearby Homes
- 1426 Thunderwood Ln SW
- 6243 David Ln SW
- 1550 Greenbrook Dr
- 1310 Dillon Rd
- 1397 Jewell Ct SW
- 1144 Angelia Dr SW
- 5800 Cedar Ln SW
- 1076 Stoney Creek Ln
- 1065 Stoney Creek Ln Unit 2
- 1582 Pine Cir
- 5832 Silver Lake Dr
- 1031 Bettina Ct SW
- 1628 Pendley Dr
- 1576 S Gordon Rd
- 1034 Bettina Ct SW
- 6302 Mount Pisgah Ln
- 6445 Sherwood Trail
- 1766 Blossom Ln
- 1435 Marlene Ln SW
- 1409 Marlene Ln SW
- 1424 Lucky Ln SW
- 1447 Marlene Ln SW
- 1436 Marlene Ln SW
- 1410 Lucky Ln SW
- 1397 Marlene Ln SW
- 1436 Lucky Ln SW
- 1410 Marlene Ln SW
- 1396 Lucky Ln SW
- 1448 Lucky Ln SW
- 1448 Marlene Ln SW
- 1461 Marlene Ln SW
- 6188 Roy Ave SW
- 1390 Marlene Ln SW
- 1462 Lucky Ln SW
- 1462 Marlene Ln SW
- 1384 Lucky Ln SW
- 1433 Lucky Ln SW
- 1435 Thunderwood Ln SW