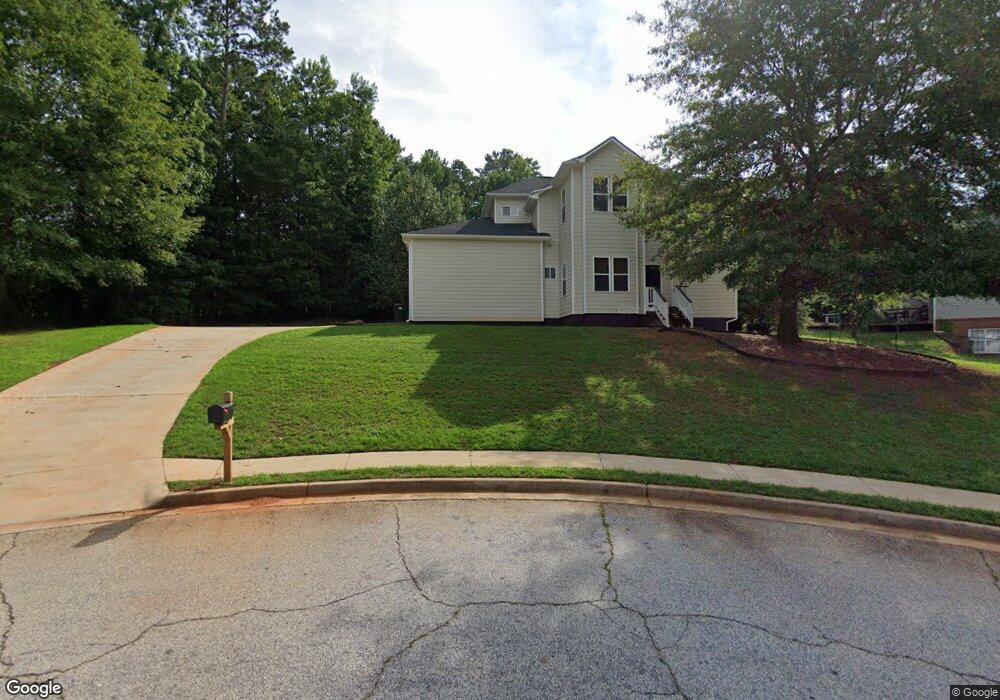
1423 Pickett's Ct Conyers, GA 30013
Estimated Value: $316,000 - $362,000
4
Beds
3
Baths
2,026
Sq Ft
$169/Sq Ft
Est. Value
About This Home
This home is located at 1423 Pickett's Ct, Conyers, GA 30013 and is currently estimated at $341,607, approximately $168 per square foot. 1423 Pickett's Ct is a home located in Rockdale County with nearby schools including Peek's Chapel Elementary School, Memorial Middle School, and Salem High School.
Ownership History
Date
Name
Owned For
Owner Type
Purchase Details
Closed on
Apr 8, 2019
Sold by
Capo Giovanni Di
Bought by
Austin Randolph
Current Estimated Value
Home Financials for this Owner
Home Financials are based on the most recent Mortgage that was taken out on this home.
Original Mortgage
$190,000
Outstanding Balance
$167,380
Interest Rate
4.4%
Mortgage Type
New Conventional
Estimated Equity
$174,227
Purchase Details
Closed on
Oct 30, 2017
Bought by
Capo Giovanni Di
Purchase Details
Closed on
Nov 5, 2008
Sold by
Spezzano Mark E and Spezzano Susan H
Bought by
Meridian R/E Ventures Inc
Purchase Details
Closed on
Oct 31, 1995
Sold by
Falcon Devel Inc
Bought by
Spezzano Mark E Susan H
Purchase Details
Closed on
Sep 14, 1995
Sold by
Jerry Miller Inc
Bought by
Falcon Development Inc
Create a Home Valuation Report for This Property
The Home Valuation Report is an in-depth analysis detailing your home's value as well as a comparison with similar homes in the area
Home Values in the Area
Average Home Value in this Area
Purchase History
| Date | Buyer | Sale Price | Title Company |
|---|---|---|---|
| Austin Randolph | $200,000 | -- | |
| Capo Giovanni Di | $26,500 | -- | |
| Meridian R/E Ventures Inc | $17,000 | -- | |
| Spezzano Mark E Susan H | $158,000 | -- | |
| Falcon Development Inc | $24,000 | -- |
Source: Public Records
Mortgage History
| Date | Status | Borrower | Loan Amount |
|---|---|---|---|
| Open | Austin Randolph | $190,000 | |
| Closed | Falcon Development Inc | $0 |
Source: Public Records
Tax History Compared to Growth
Tax History
| Year | Tax Paid | Tax Assessment Tax Assessment Total Assessment is a certain percentage of the fair market value that is determined by local assessors to be the total taxable value of land and additions on the property. | Land | Improvement |
|---|---|---|---|---|
| 2024 | $6,510 | $164,800 | $32,400 | $132,400 |
| 2023 | $5,738 | $141,200 | $23,600 | $117,600 |
| 2022 | $3,094 | $74,600 | $13,080 | $61,520 |
| 2021 | $3,061 | $74,600 | $13,080 | $61,520 |
| 2020 | $3,199 | $74,600 | $13,080 | $61,520 |
| 2019 | $303 | $24,200 | $3,255 | $20,945 |
| 2018 | $1,158 | $25,240 | $9,560 | $15,680 |
| 2017 | $345 | $7,160 | $7,160 | $0 |
| 2016 | $345 | $7,160 | $7,160 | $0 |
| 2015 | $255 | $5,160 | $5,160 | $0 |
| 2014 | $336 | $6,880 | $6,880 | $0 |
| 2013 | -- | $12,080 | $12,080 | $0 |
Source: Public Records
Map
Nearby Homes
- 1695 Underwood Dr SE
- 3453 Underwood Rd SE
- 229 Lotus Ln
- 234 Lotus Ln Unit 79
- 234 Lotus Ln
- 263 Lotus Ln Unit 21
- 3738 Windy Hill Dr SE
- 65 Lotus Ln
- 65 Allspice Dr
- 2184 Hampton Trail SE
- 3440 Concord Corner SE
- 255 Radcliffe Trace
- 3296 Haverhill Ct SE
- 254 Lotus Ln Unit 78
- 30 Fox Glove Dr
- Grandview Plan at Underwood Crossing
- Royal Plan at Underwood Crossing
- Stanley Plan at Underwood Crossing
- Waverly Plan at Underwood Crossing
- Eliott Plan at Underwood Crossing
- 1423 Pickets Ct SE Unit 12
- 1423 Pickets Ct SE
- 1425 Pickets Ct SE
- 1421 Pickets Ct SE Unit /11
- 1421 Pickets Ct SE
- 1421 Pickett's Ct
- 1424 Pickets Ct SE
- 1422 Pickett's Ct
- 1422 Pickets Ct SE
- 1419 Pickets Ct SE
- 1420 Pickets Ct SE
- 1420 Pickett's Ct
- 1417 Pickets Ct SE
- 1417 Pickets Ct SE Unit S
- 1417 Pickett's Ct
- 1418 Pickets Ct SE
- 1416 Pickets Ct SE
- 1415 Pickets Ct SE
- 1417 Pickett S
- 1414 Pickett's Ct