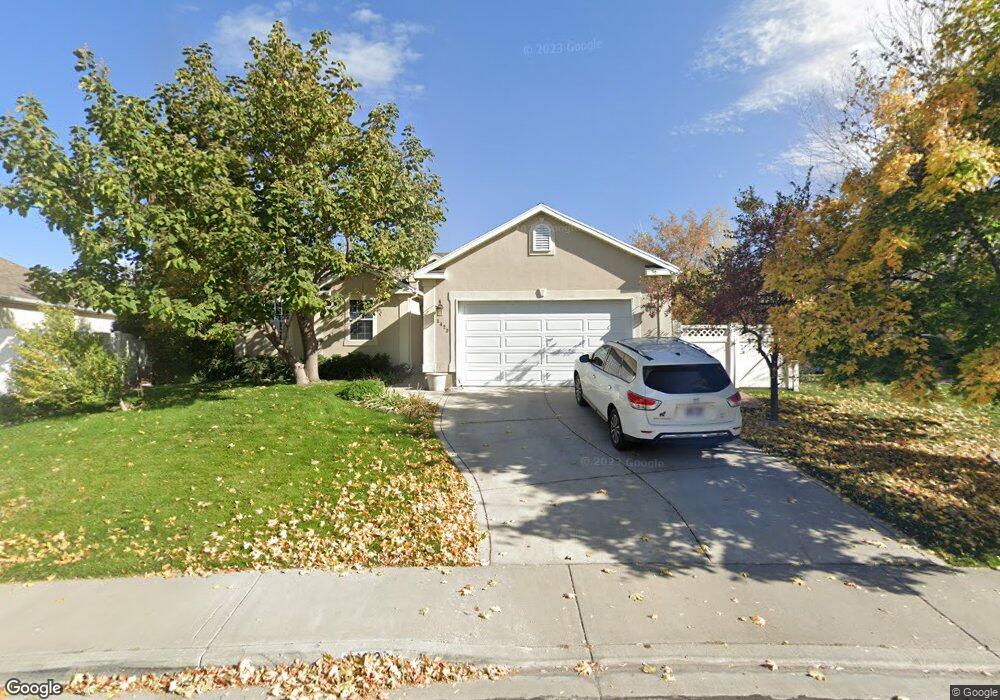
1423 S 680 W Payson, UT 84651
Estimated Value: $492,000 - $526,000
6
Beds
3
Baths
2,702
Sq Ft
$189/Sq Ft
Est. Value
About This Home
This home is located at 1423 S 680 W, Payson, UT 84651 and is currently estimated at $510,606, approximately $188 per square foot. 1423 S 680 W is a home located in Utah County with nearby schools including Spring Lake Elementary, Payson Junior High School, and Payson High School.
Ownership History
Date
Name
Owned For
Owner Type
Purchase Details
Closed on
May 16, 2024
Sold by
Sorensen Jason and Sorensen Cierra
Bought by
Sorensen Asset Protection Trust and Sorensen
Current Estimated Value
Purchase Details
Closed on
Aug 7, 2023
Sold by
Peabody Robyne L
Bought by
Sorensen Jason and Sorensen Cierra
Home Financials for this Owner
Home Financials are based on the most recent Mortgage that was taken out on this home.
Original Mortgage
$391,920
Interest Rate
6.67%
Mortgage Type
New Conventional
Purchase Details
Closed on
Aug 7, 2000
Sold by
Country Living Development Inc
Bought by
Peabody Frederick J and Peabody Robyne L
Home Financials for this Owner
Home Financials are based on the most recent Mortgage that was taken out on this home.
Original Mortgage
$121,200
Interest Rate
8.19%
Create a Home Valuation Report for This Property
The Home Valuation Report is an in-depth analysis detailing your home's value as well as a comparison with similar homes in the area
Home Values in the Area
Average Home Value in this Area
Purchase History
| Date | Buyer | Sale Price | Title Company |
|---|---|---|---|
| Sorensen Asset Protection Trust | -- | None Listed On Document | |
| Sorensen Jason | -- | Highland Title | |
| Peabody Frederick J | -- | First American Title Co |
Source: Public Records
Mortgage History
| Date | Status | Borrower | Loan Amount |
|---|---|---|---|
| Previous Owner | Sorensen Jason | $391,920 | |
| Previous Owner | Peabody Frederick J | $121,200 |
Source: Public Records
Tax History
| Year | Tax Paid | Tax Assessment Tax Assessment Total Assessment is a certain percentage of the fair market value that is determined by local assessors to be the total taxable value of land and additions on the property. | Land | Improvement |
|---|---|---|---|---|
| 2025 | $2,568 | $277,695 | -- | -- |
| 2024 | $2,568 | $261,360 | $0 | $0 |
| 2023 | $2,611 | $266,420 | $0 | $0 |
| 2022 | $2,525 | $253,440 | $0 | $0 |
| 2021 | $2,136 | $343,800 | $115,400 | $228,400 |
| 2020 | $2,024 | $318,800 | $104,900 | $213,900 |
| 2019 | $1,862 | $300,700 | $86,800 | $213,900 |
| 2018 | $1,728 | $268,900 | $76,000 | $192,900 |
| 2017 | $1,628 | $136,290 | $0 | $0 |
| 2016 | $1,562 | $129,910 | $0 | $0 |
| 2015 | $1,494 | $123,365 | $0 | $0 |
| 2014 | $1,357 | $112,915 | $0 | $0 |
Source: Public Records
Map
Nearby Homes
- 802 Brookside Ct
- 1468 S 910 W
- 609 W Saddlebrook Dr
- 1631 S Highway 198
- 613 Saddlebrook Dr
- 1163 S 730 W
- 1589 S 840 W
- 1320 S 950 W
- 1172 S 880 W
- 1333 S 1050 W
- 1338 S 1050 W
- 1116 W 1290 S
- 2003 S 1150 W Unit 1040
- 1146 W 1260 S
- 991 S 930 W
- 1128 W 1150 S Unit 9
- 1216 S 1150 W Unit 19
- 245 W 1770 S
- 1835 S 410 W
- 1733 S 1100 W
- 1423 S 680 W Unit lot 31
- 1427 S 680 W
- 1427 S 680 W Unit 32
- 1433 S 680 W
- 672 W 1410 S
- 672 W 1410 S Unit Lot 28
- 1406 S Highway 198
- 1422 S 680 W
- 1425 S Highway 198
- 678 W 1410 S
- 1412 S 600 W
- 1428 S 680 W
- 697 W 1410 S
- 1439 S 680 W
- 1408 S 600 W
- 1435 Utah 198
- 1434 S 680 W
- 1435 S Highway 198
- 694 W 1410 S
- 694 W 1410 S Unit LOT 26
Your Personal Tour Guide
Ask me questions while you tour the home.