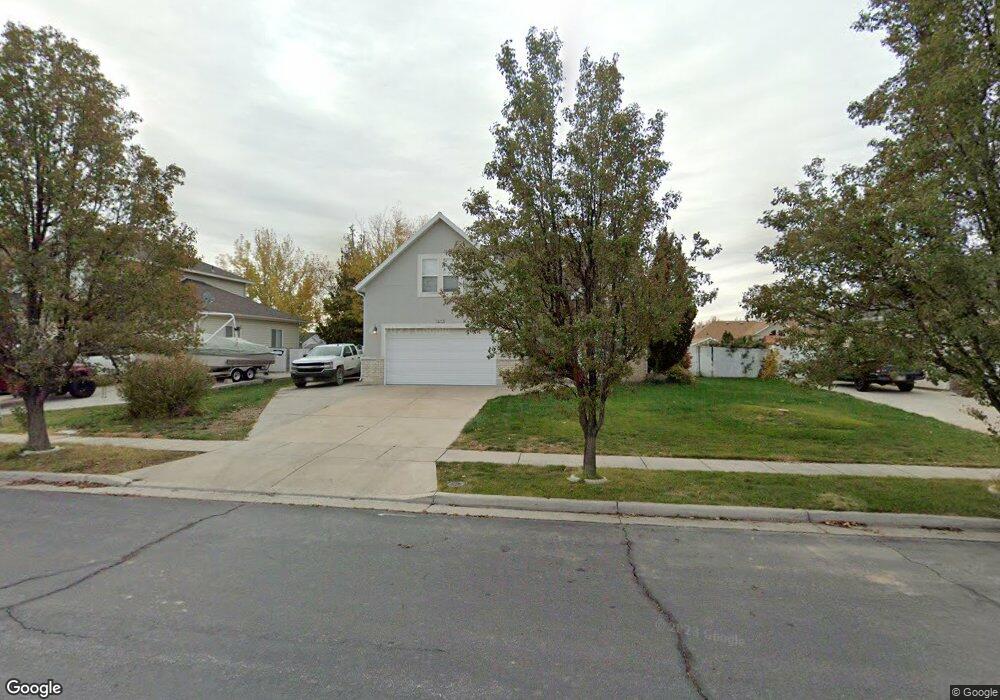
1423 W 2325 S Syracuse, UT 84075
Estimated Value: $622,000 - $685,000
5
Beds
4
Baths
3,148
Sq Ft
$205/Sq Ft
Est. Value
About This Home
This home is located at 1423 W 2325 S, Syracuse, UT 84075 and is currently estimated at $644,387, approximately $204 per square foot. 1423 W 2325 S is a home located in Davis County with nearby schools including Bluff Ridge Elementary, Legacy Junior High School, and Clearfield High School.
Ownership History
Date
Name
Owned For
Owner Type
Purchase Details
Closed on
Nov 21, 2019
Sold by
Hinz Lesli
Bought by
Houchins Christopher Lee
Current Estimated Value
Home Financials for this Owner
Home Financials are based on the most recent Mortgage that was taken out on this home.
Original Mortgage
$336,205
Outstanding Balance
$295,181
Interest Rate
3.5%
Mortgage Type
New Conventional
Estimated Equity
$349,206
Purchase Details
Closed on
May 5, 2018
Sold by
Hinz Joel C and Hinz Leslie A
Bought by
Hinz Leslie
Home Financials for this Owner
Home Financials are based on the most recent Mortgage that was taken out on this home.
Original Mortgage
$284,084
Interest Rate
4.44%
Mortgage Type
FHA
Purchase Details
Closed on
Jun 1, 2009
Sold by
Hinz Joel C
Bought by
Hinz Joel C and Hinz Lesli A
Purchase Details
Closed on
Jun 12, 1998
Sold by
Rainey Construction Inc
Bought by
Hinz Joel C
Create a Home Valuation Report for This Property
The Home Valuation Report is an in-depth analysis detailing your home's value as well as a comparison with similar homes in the area
Home Values in the Area
Average Home Value in this Area
Purchase History
| Date | Buyer | Sale Price | Title Company |
|---|---|---|---|
| Houchins Christopher Lee | -- | Intermountain Title | |
| Hinz Leslie | -- | -- | |
| Hinz Joel C | -- | None Available | |
| Hinz Joel C | -- | First American Title Co |
Source: Public Records
Mortgage History
| Date | Status | Borrower | Loan Amount |
|---|---|---|---|
| Open | Houchins Christopher Lee | $336,205 | |
| Previous Owner | Hinz Leslie | $284,084 |
Source: Public Records
Tax History Compared to Growth
Tax History
| Year | Tax Paid | Tax Assessment Tax Assessment Total Assessment is a certain percentage of the fair market value that is determined by local assessors to be the total taxable value of land and additions on the property. | Land | Improvement |
|---|---|---|---|---|
| 2025 | $3,335 | $321,750 | $125,024 | $196,726 |
| 2024 | $3,143 | $305,250 | $103,457 | $201,793 |
| 2023 | $2,978 | $527,000 | $144,152 | $382,848 |
| 2022 | $3,106 | $301,400 | $82,972 | $218,428 |
| 2021 | $2,836 | $426,000 | $122,621 | $303,379 |
| 2020 | $2,531 | $368,000 | $106,789 | $261,211 |
| 2019 | $2,340 | $336,000 | $104,414 | $231,586 |
| 2018 | $2,169 | $309,000 | $100,824 | $208,176 |
| 2016 | $2,026 | $151,360 | $38,697 | $112,663 |
| 2015 | $1,938 | $137,940 | $38,697 | $99,243 |
| 2014 | $2,041 | $148,025 | $38,697 | $109,328 |
| 2013 | -- | $157,522 | $38,775 | $118,747 |
Source: Public Records
Map
Nearby Homes
- 1315 W 2325 S
- 1306 W 2325 S
- 1295 W 2325 S
- 1286 W 2325 S
- 2355 S 1230 W
- 1196 W 2325 S
- 1156 W 2325 S
- 1137 W 2275 S
- 2480 S 1150 W
- 1116 W 2325 S
- 1137 2275 S
- 2194 S 1800 W
- 1137 W 2500 S
- 1148 W 2050 S
- 1142 W 2050 S
- 2742 S Allison Way Unit 212
- 2232 S 1000 W
- 1079 W 2050 S
- 1667 W 2770 S Unit 206
- 2766 S 1200 W