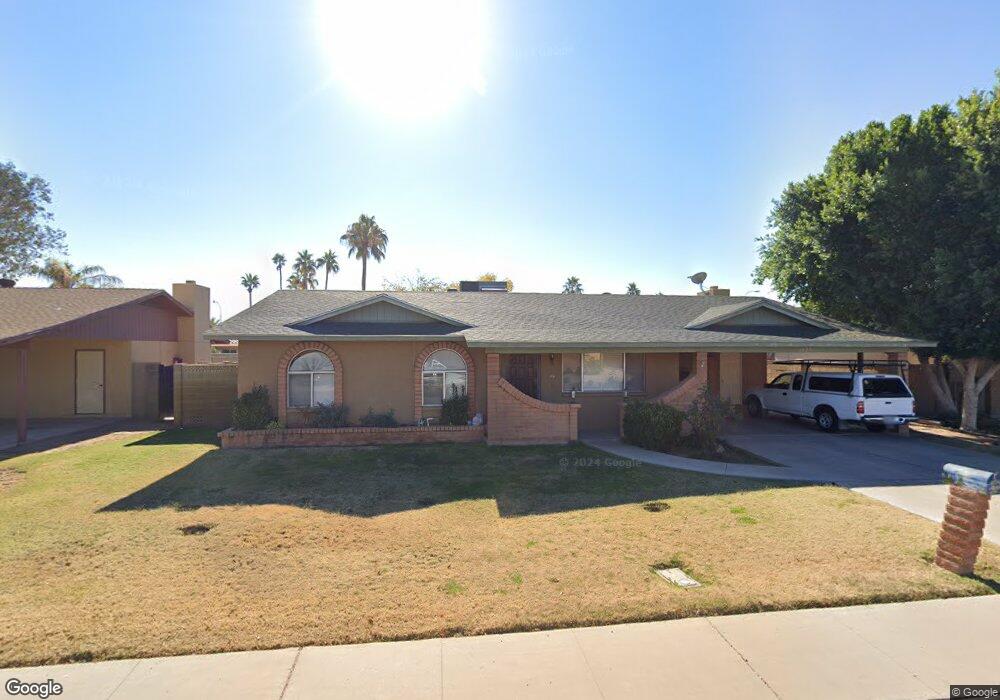
1423 W Megan St Chandler, AZ 85224
Arrowhead Meadows NeighborhoodEstimated Value: $417,309 - $499,000
--
Bed
2
Baths
1,720
Sq Ft
$276/Sq Ft
Est. Value
About This Home
This home is located at 1423 W Megan St, Chandler, AZ 85224 and is currently estimated at $474,077, approximately $275 per square foot. 1423 W Megan St is a home located in Maricopa County with nearby schools including Hartford Sylvia Encinas Elementary School, Andersen Junior High School, and Chandler High School.
Ownership History
Date
Name
Owned For
Owner Type
Purchase Details
Closed on
Jun 23, 2005
Sold by
Workman Matt C
Bought by
Lucio Jose Luis and Lucio Elva
Current Estimated Value
Home Financials for this Owner
Home Financials are based on the most recent Mortgage that was taken out on this home.
Original Mortgage
$85,000
Outstanding Balance
$43,975
Interest Rate
5.62%
Mortgage Type
New Conventional
Estimated Equity
$430,102
Purchase Details
Closed on
Sep 21, 2004
Sold by
Workman Matt C and Workman Megan A
Bought by
Workman Matt C
Home Financials for this Owner
Home Financials are based on the most recent Mortgage that was taken out on this home.
Original Mortgage
$141,000
Interest Rate
5.26%
Mortgage Type
New Conventional
Purchase Details
Closed on
Jan 23, 2001
Sold by
Dejaynes Margo J and Dejaynes Hubert D
Bought by
Workman Matt C and Workman Megan A
Home Financials for this Owner
Home Financials are based on the most recent Mortgage that was taken out on this home.
Original Mortgage
$134,105
Interest Rate
7.41%
Mortgage Type
FHA
Create a Home Valuation Report for This Property
The Home Valuation Report is an in-depth analysis detailing your home's value as well as a comparison with similar homes in the area
Home Values in the Area
Average Home Value in this Area
Purchase History
| Date | Buyer | Sale Price | Title Company |
|---|---|---|---|
| Lucio Jose Luis | $235,000 | Camelback Title Agency Llc | |
| Workman Matt C | -- | Archer Land Title Inc | |
| Workman Matt C | $136,000 | Stewart Title & Trust |
Source: Public Records
Mortgage History
| Date | Status | Borrower | Loan Amount |
|---|---|---|---|
| Open | Lucio Jose Luis | $85,000 | |
| Previous Owner | Workman Matt C | $141,000 | |
| Previous Owner | Workman Matt C | $134,105 |
Source: Public Records
Tax History Compared to Growth
Tax History
| Year | Tax Paid | Tax Assessment Tax Assessment Total Assessment is a certain percentage of the fair market value that is determined by local assessors to be the total taxable value of land and additions on the property. | Land | Improvement |
|---|---|---|---|---|
| 2025 | $1,353 | $17,365 | -- | -- |
| 2024 | $1,307 | $16,538 | -- | -- |
| 2023 | $1,307 | $34,470 | $6,890 | $27,580 |
| 2022 | $1,261 | $25,710 | $5,140 | $20,570 |
| 2021 | $1,321 | $23,720 | $4,740 | $18,980 |
| 2020 | $1,315 | $21,860 | $4,370 | $17,490 |
| 2019 | $1,265 | $20,170 | $4,030 | $16,140 |
| 2018 | $1,225 | $18,530 | $3,700 | $14,830 |
| 2017 | $1,142 | $17,270 | $3,450 | $13,820 |
| 2016 | $1,100 | $16,560 | $3,310 | $13,250 |
| 2015 | $1,066 | $14,750 | $2,950 | $11,800 |
Source: Public Records
Map
Nearby Homes
- 1592 W Shannon Ct
- 1233 W Dublin St
- 1530 W Ivanhoe Ct
- 1050 N Verano Way
- 1640 W Gail Dr
- 765 N Arrowhead Dr
- 1825 W Ray Rd Unit 2036
- 1825 W Ray Rd Unit 1068
- 1825 W Ray Rd Unit 1008
- 1825 W Ray Rd Unit 1063
- 1825 W Ray Rd Unit 1054
- 1825 W Ray Rd Unit 2070
- 1825 W Ray Rd Unit 2044
- 1825 W Ray Rd Unit 1083
- 1825 W Ray Rd Unit 2082
- 1825 W Ray Rd Unit 2052
- 1551 W Ironwood Dr
- 1293 W Orchid Ln
- 1018 W Ivanhoe St
- 590 N Cholla St
- 1421 W Megan St
- 1425 W Megan St
- 1396 W Shannon St
- 1384 W Shannon St
- 1412 W Shannon St
- 1424 W Megan St
- 1422 W Megan St
- 1426 W Megan St
- 1370 W Shannon St
- 1420 W Megan St
- 1417 W Megan St Unit 3
- 1356 W Shannon St
- 961 N Longmore St
- 1397 W Shannon St
- 1418 W Megan St
- 971 N Longmore St
- 1411 W Shannon St
- 1383 W Shannon St
- 981 N Longmore St
- 931 N Longmore St