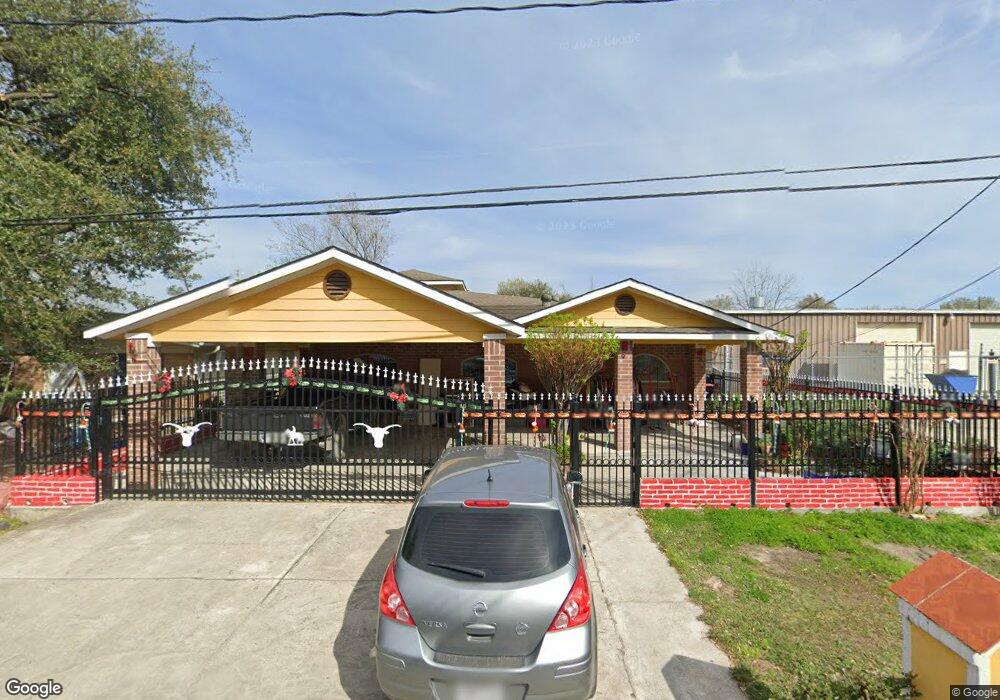
14231 Bandera St Houston, TX 77015
Estimated Value: $145,000 - $344,000
3
Beds
2
Baths
1,092
Sq Ft
$246/Sq Ft
Est. Value
About This Home
This home is located at 14231 Bandera St, Houston, TX 77015 and is currently estimated at $268,274, approximately $245 per square foot. 14231 Bandera St is a home located in Harris County with nearby schools including Cloverleaf Elementary School, Cobb 6th Grade Campus, and North Shore Middle School.
Ownership History
Date
Name
Owned For
Owner Type
Purchase Details
Closed on
Feb 26, 2010
Sold by
Waldrop Chris
Bought by
Moreno Teresa D
Current Estimated Value
Home Financials for this Owner
Home Financials are based on the most recent Mortgage that was taken out on this home.
Original Mortgage
$15,000
Outstanding Balance
$9,976
Interest Rate
5.05%
Mortgage Type
Seller Take Back
Estimated Equity
$258,298
Purchase Details
Closed on
Aug 15, 2003
Sold by
Hicks Robert M and Hicks Phyllis
Bought by
Waldrop Chris
Purchase Details
Closed on
May 4, 1995
Sold by
Idrissou Khelaf and Idrissou Salima
Bought by
Hicks Robert M
Home Financials for this Owner
Home Financials are based on the most recent Mortgage that was taken out on this home.
Original Mortgage
$36,850
Interest Rate
8.36%
Mortgage Type
Purchase Money Mortgage
Create a Home Valuation Report for This Property
The Home Valuation Report is an in-depth analysis detailing your home's value as well as a comparison with similar homes in the area
Home Values in the Area
Average Home Value in this Area
Purchase History
| Date | Buyer | Sale Price | Title Company |
|---|---|---|---|
| Moreno Teresa D | -- | Texas American Title Company | |
| Waldrop Chris | -- | Texas American Title Company | |
| Hicks Robert M | -- | Houston Title |
Source: Public Records
Mortgage History
| Date | Status | Borrower | Loan Amount |
|---|---|---|---|
| Open | Moreno Teresa D | $15,000 | |
| Previous Owner | Hicks Robert M | $36,850 |
Source: Public Records
Tax History Compared to Growth
Tax History
| Year | Tax Paid | Tax Assessment Tax Assessment Total Assessment is a certain percentage of the fair market value that is determined by local assessors to be the total taxable value of land and additions on the property. | Land | Improvement |
|---|---|---|---|---|
| 2025 | $2,405 | $324,885 | $53,025 | $271,860 |
| 2024 | $2,405 | $336,934 | $53,025 | $283,909 |
| 2023 | $2,405 | $437,897 | $31,815 | $406,082 |
| 2022 | $3,842 | $334,025 | $31,815 | $302,210 |
| 2021 | $3,775 | $250,727 | $25,187 | $225,540 |
| 2020 | $3,518 | $199,381 | $25,187 | $174,194 |
| 2019 | $3,375 | $143,300 | $25,187 | $118,113 |
| 2018 | $988 | $109,712 | $25,187 | $84,525 |
| 2017 | $1,574 | $56,444 | $25,187 | $31,257 |
| 2016 | $1,574 | $56,444 | $25,187 | $31,257 |
| 2015 | $844 | $56,444 | $25,187 | $31,257 |
| 2014 | $844 | $48,659 | $18,559 | $30,100 |
Source: Public Records
Map
Nearby Homes
- 14307 Laredo St
- 816 Barbara Mae St
- 813 Barbara Mae St
- 14615 Victoria St
- 0 Victoria St
- 14500 Corpus Christi St Unit 4
- 14504 Corpus Christi St Unit 4
- 14506 Corpus Christi St Unit 4
- 638 Hollywood St
- 14613 Hillsboro St
- 14334 Texarkana St
- 1035 Nadolney St
- 13842 Laredo St
- 14619 Brownsville St
- 14512 Texarkana St
- 14750 Kenny St
- 639 Manor St
- 530 Frankie St Unit 1
- 14622 Kenny St
- TBD Gainesville St
- 14227 Bandera St
- 14223 Bandera St
- 14230 Greenville St
- 14219 Bandera St
- 14218 Greenville St
- 14213 Bandera St
- 14232 Bandera St Unit B
- 14226 Bandera St
- 14210 Greenville St
- 14209 Bandera St
- 1024 Barbara Mae St
- 14214 Bandera St
- 14237 Bonham St
- 14235 Greenville St
- 14219 Bonham St
- 14205 Bandera St
- 14301 Bandera St
- 14219 Greenville St
- 1028 Barbara Mae St
- 1 Bandera