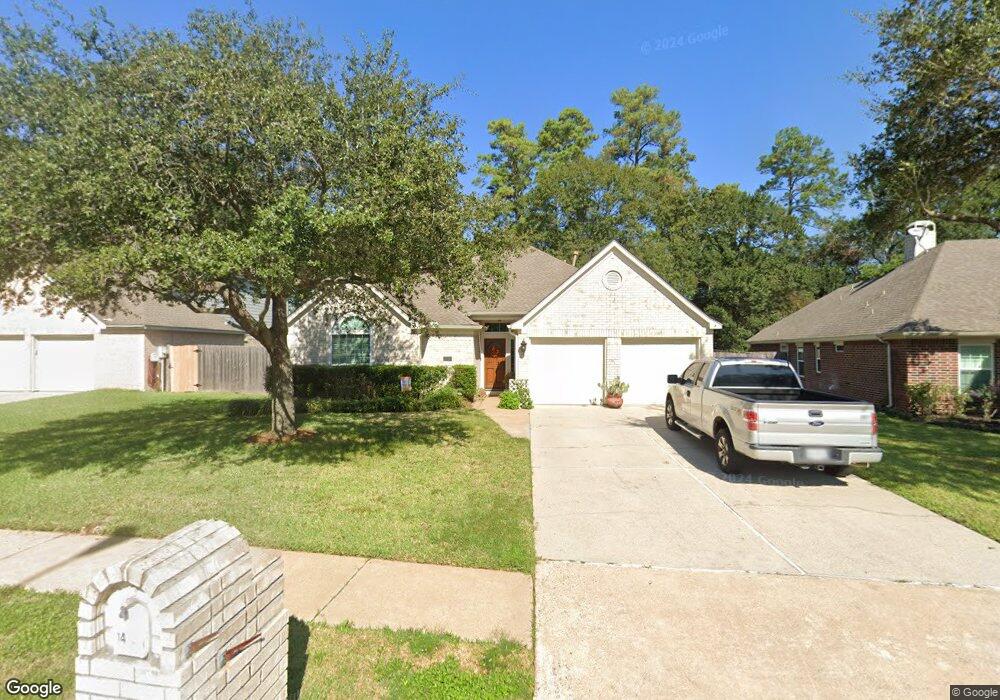
14231 Faulkey Gully Houston, TX 77070
Estimated Value: $356,869 - $408,000
4
Beds
2
Baths
2,427
Sq Ft
$154/Sq Ft
Est. Value
About This Home
This home is located at 14231 Faulkey Gully, Houston, TX 77070 and is currently estimated at $373,217, approximately $153 per square foot. 14231 Faulkey Gully is a home located in Harris County with nearby schools including Moore Elementary School, Hamilton Middle School, and Cypress Creek High School.
Ownership History
Date
Name
Owned For
Owner Type
Purchase Details
Closed on
May 10, 2011
Sold by
Wang Ge and Sun Wenxin
Bought by
Sumners Sidney L
Current Estimated Value
Home Financials for this Owner
Home Financials are based on the most recent Mortgage that was taken out on this home.
Original Mortgage
$132,000
Interest Rate
4.28%
Mortgage Type
New Conventional
Purchase Details
Closed on
May 1, 2000
Sold by
Stere Lester M and Stere Charlanne M
Bought by
Wang Ge and Sun Wenxin
Home Financials for this Owner
Home Financials are based on the most recent Mortgage that was taken out on this home.
Original Mortgage
$136,000
Interest Rate
8.66%
Purchase Details
Closed on
Nov 19, 1997
Sold by
Perry Homes
Bought by
Stere Lester M and Stere Charlanne M
Home Financials for this Owner
Home Financials are based on the most recent Mortgage that was taken out on this home.
Original Mortgage
$111,750
Interest Rate
7.3%
Create a Home Valuation Report for This Property
The Home Valuation Report is an in-depth analysis detailing your home's value as well as a comparison with similar homes in the area
Home Values in the Area
Average Home Value in this Area
Purchase History
| Date | Buyer | Sale Price | Title Company |
|---|---|---|---|
| Sumners Sidney L | -- | Chicago Title | |
| Wang Ge | -- | Alamo Title | |
| Stere Lester M | -- | Chicago Title |
Source: Public Records
Mortgage History
| Date | Status | Borrower | Loan Amount |
|---|---|---|---|
| Previous Owner | Sumners Sidney L | $132,000 | |
| Previous Owner | Wang Ge | $136,000 | |
| Previous Owner | Stere Lester M | $111,750 |
Source: Public Records
Tax History Compared to Growth
Tax History
| Year | Tax Paid | Tax Assessment Tax Assessment Total Assessment is a certain percentage of the fair market value that is determined by local assessors to be the total taxable value of land and additions on the property. | Land | Improvement |
|---|---|---|---|---|
| 2025 | $1,342 | $382,910 | $98,125 | $284,785 |
| 2024 | $1,342 | $377,421 | $89,031 | $288,390 |
| 2023 | $1,342 | $399,226 | $89,031 | $310,195 |
| 2022 | $6,923 | $355,547 | $74,192 | $281,355 |
| 2021 | $6,620 | $295,077 | $71,967 | $223,110 |
| 2020 | $6,199 | $263,303 | $43,180 | $220,123 |
| 2019 | $6,380 | $260,521 | $35,168 | $225,353 |
| 2018 | $1,079 | $156,153 | $37,814 | $118,339 |
| 2017 | $6,611 | $270,418 | $37,814 | $232,604 |
| 2016 | $6,263 | $270,418 | $37,814 | $232,604 |
| 2015 | $4,071 | $244,926 | $37,814 | $207,112 |
| 2014 | $4,071 | $223,590 | $37,814 | $185,776 |
Source: Public Records
Map
Nearby Homes
- 12 Lakeview Place
- 11502 Primwood Dr
- 11723 Quail Creek Dr
- 11515 Normont Dr
- 14907 Pine Point Ct
- 11807 Primwood Dr
- 11803 Pebbleton Dr
- 15206 Beacham Dr
- 11410 Rothglen St
- 11715 Park Creek Dr
- 15118 Stillcreek Dr
- 11607 Knobcrest Dr
- 13911 Cypresswood Crossing Blvd
- 11602 Jaycreek Dr
- 11614 Brookfalls Dr
- 15102 Rolling Oaks Dr
- 10822 Normont Dr
- 11631 Jaycreek Dr
- 11906 Moorcreek Dr
- 14615 Sunny Grove Dr
- 14235 Faulkey Gully
- 14227 Faulkey Gully
- 14239 Faulkey Gully
- 14223 Faulkey Gully
- 14230 Faulkey Gully
- 14234 Faulkey Gully
- 14219 Faulkey Gully
- 14238 Faulkey Gully
- 14215 Faulkey Gully
- 14242 Faulkey Gully
- 14211 Faulkey Gully
- 14222 Saddlebend Dr
- 14218 Saddlebend Dr
- 14226 Saddlebend Dr
- 14214 Saddlebend Dr
- 11414 Parkriver Dr
- 11410 Parkriver Dr
- 14246 Faulkey Gully
- 14207 Faulkey Gully
- 11406 Parkriver Dr