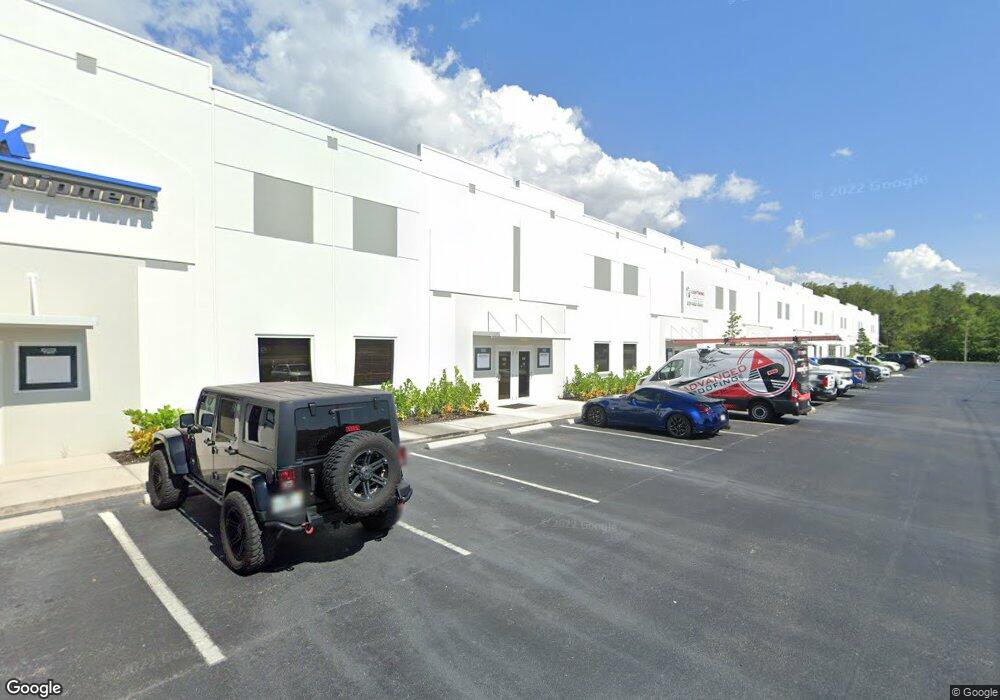
14231 Jetport Loop W Unit 6, 7 & 8 Fort Myers, FL 33913
Estimated Value: $4,086,183
--
Bed
17
Baths
28,000
Sq Ft
$146/Sq Ft
Est. Value
About This Home
This home is located at 14231 Jetport Loop W Unit 6, 7 & 8, Fort Myers, FL 33913 and is currently estimated at $4,086,183, approximately $145 per square foot. 14231 Jetport Loop W Unit 6, 7 & 8 is a home located in Lee County with nearby schools including Gateway Elementary School, Tice Elementary School, and Orange River Elementary School.
Ownership History
Date
Name
Owned For
Owner Type
Purchase Details
Closed on
Mar 24, 2010
Sold by
14231 Jetport Loop Holdings Llc
Bought by
The Drake Chocholek Living Trust and The Darren D Chocholek Living Trust
Current Estimated Value
Home Financials for this Owner
Home Financials are based on the most recent Mortgage that was taken out on this home.
Original Mortgage
$700,000
Outstanding Balance
$221,738
Interest Rate
4.91%
Mortgage Type
Commercial
Estimated Equity
$3,864,445
Purchase Details
Closed on
Oct 30, 2008
Sold by
175 Jetport Llc
Bought by
14231 Jetport Loop Holdings Llc
Purchase Details
Closed on
Mar 30, 2004
Sold by
Borealis Lp
Bought by
175 Jetport Llc and Dolly Varden Llc
Home Financials for this Owner
Home Financials are based on the most recent Mortgage that was taken out on this home.
Original Mortgage
$9,000,000
Interest Rate
5.53%
Mortgage Type
Commercial
Purchase Details
Closed on
Jul 15, 1999
Sold by
Colosimo James R
Bought by
Eckerty Thomas G
Create a Home Valuation Report for This Property
The Home Valuation Report is an in-depth analysis detailing your home's value as well as a comparison with similar homes in the area
Home Values in the Area
Average Home Value in this Area
Purchase History
| Date | Buyer | Sale Price | Title Company |
|---|---|---|---|
| The Drake Chocholek Living Trust | $1,400,000 | First American Title Ins Co | |
| 14231 Jetport Loop Holdings Llc | $11,800,000 | Attorney | |
| 175 Jetport Llc | $5,100,000 | -- | |
| Eckerty Thomas G | -- | -- |
Source: Public Records
Mortgage History
| Date | Status | Borrower | Loan Amount |
|---|---|---|---|
| Open | The Drake Chocholek Living Trust | $700,000 | |
| Previous Owner | 175 Jetport Llc | $9,000,000 |
Source: Public Records
Tax History Compared to Growth
Tax History
| Year | Tax Paid | Tax Assessment Tax Assessment Total Assessment is a certain percentage of the fair market value that is determined by local assessors to be the total taxable value of land and additions on the property. | Land | Improvement |
|---|---|---|---|---|
| 2025 | $47,684 | $2,375,649 | -- | -- |
| 2024 | $43,037 | $2,159,681 | -- | -- |
| 2023 | $43,037 | $1,963,346 | $0 | $0 |
| 2022 | $35,613 | $1,784,860 | $0 | $0 |
| 2021 | $32,966 | $3,108,676 | $1,013,785 | $2,094,891 |
| 2020 | $23,942 | $1,681,766 | $488,833 | $1,192,933 |
| 2019 | $21,293 | $1,407,576 | $402,096 | $1,005,480 |
| 2018 | $19,432 | $1,219,084 | $320,119 | $898,965 |
| 2017 | $18,805 | $1,145,764 | $229,796 | $915,968 |
| 2016 | $19,103 | $1,146,028 | $251,930 | $894,098 |
| 2015 | $17,997 | $1,065,319 | $304,113 | $761,206 |
| 2014 | $19,226 | $1,194,777 | $336,627 | $858,150 |
| 2013 | -- | $1,336,188 | $646,506 | $689,682 |
Source: Public Records
Map
Nearby Homes
- 9090 Old Hickory Cir
- 14291 Hickory Links Ct Unit 1516
- 14291 Hickory Links Ct Unit 1525
- 14501 Hickory Hill Ct Unit 613
- 14511 Hickory Hill Ct Unit 523
- 14510 Hickory Hill Ct Unit 715
- 14510 Hickory Hill Ct Unit 722
- 14551 Hickory Hill Ct Unit 114
- 14551 Hickory Hill Ct Unit 125
- 14520 Hickory Hill Ct Unit 823
- 14550 Hickory Hill Ct Unit 1124
- 19451 Cromwell Ct Unit 107
- 19470 Cromwell Ct Unit 204
- 19470 Cromwell Ct Unit 103
- 8936 Cypress Preserve Place
- 8853 Cypress Preserve Place
- 14350 Bristol Bay Place Unit 207
- 8884 Cypress Preserve Place
- 15669 Fiddlesticks Blvd
- 0 Goldenwood Dr
- 14391 Old Hickory Blvd
- 14401 Old Hickory Blvd
- 14411 Old Hickory Blvd
- 14381 Old Hickory Blvd
- 14371 Old Hickory Blvd
- 14421 Old Hickory Blvd
- 14361 Old Hickory Blvd
- 14431 Old Hickory Blvd
- 14441 Old Hickory Blvd
- 14351 Old Hickory Blvd
- 14341 Old Hickory Blvd
- 14451 Old Hickory Blvd
- 9481 Old Hickory Cir
- 9471 Old Hickory Cir
- 9461 Old Hickory Cir
- 9451 Old Hickory Cir
- 14461 Old Hickory Blvd
- 9441 Old Hickory Cir
- 9431 Old Hickory Cir
- 9421 Old Hickory Cir