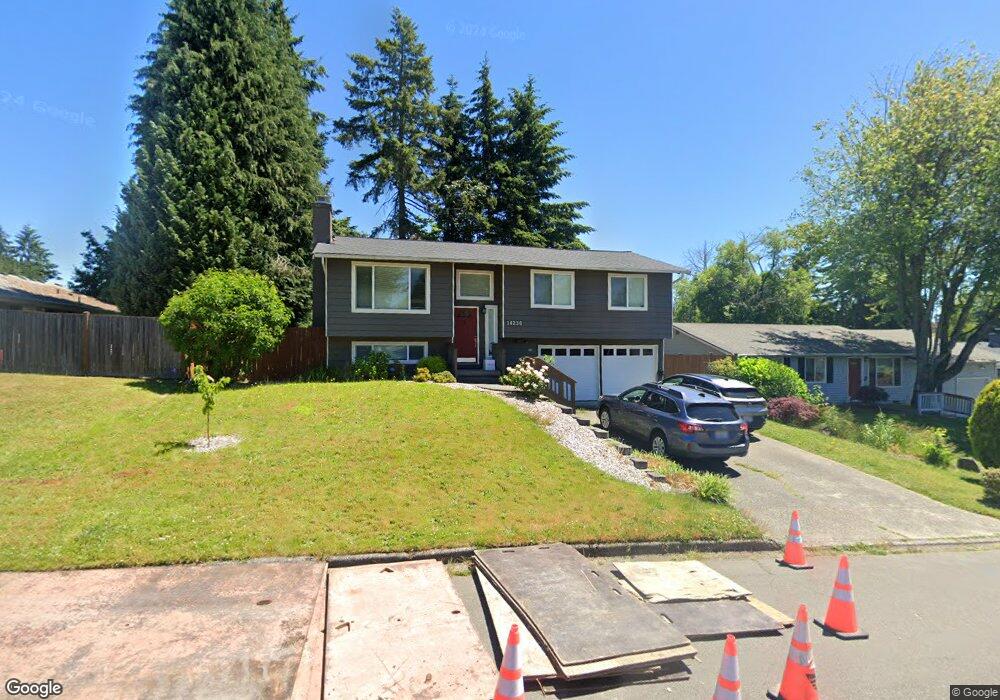
14236 82nd Ave NE Bothell, WA 98011
Finn Hill NeighborhoodEstimated Value: $1,055,000 - $1,190,000
3
Beds
2
Baths
1,220
Sq Ft
$924/Sq Ft
Est. Value
About This Home
This home is located at 14236 82nd Ave NE, Bothell, WA 98011 and is currently estimated at $1,126,818, approximately $923 per square foot. 14236 82nd Ave NE is a home located in King County with nearby schools including Henry David Thoreau Elementary School, Finn Hill Middle School, and Juanita High School.
Ownership History
Date
Name
Owned For
Owner Type
Purchase Details
Closed on
Sep 25, 2013
Sold by
Quattlebaum Terrance Lynn
Bought by
Lindberg Denise and Lindberg Eric
Current Estimated Value
Home Financials for this Owner
Home Financials are based on the most recent Mortgage that was taken out on this home.
Original Mortgage
$328,000
Outstanding Balance
$81,735
Interest Rate
3.41%
Mortgage Type
New Conventional
Estimated Equity
$1,045,083
Purchase Details
Closed on
Jul 1, 2003
Sold by
Mckinnon Liz and Quattlebaum Elizabeth A
Bought by
Quattlebaum Terrance Lynn
Home Financials for this Owner
Home Financials are based on the most recent Mortgage that was taken out on this home.
Original Mortgage
$182,000
Interest Rate
6.22%
Mortgage Type
Purchase Money Mortgage
Purchase Details
Closed on
Jul 1, 1993
Sold by
Morris Gregory B and Morris Dorothy J
Bought by
Quattlebaum Terrance Lynn
Create a Home Valuation Report for This Property
The Home Valuation Report is an in-depth analysis detailing your home's value as well as a comparison with similar homes in the area
Home Values in the Area
Average Home Value in this Area
Purchase History
| Date | Buyer | Sale Price | Title Company |
|---|---|---|---|
| Lindberg Denise | $410,000 | First American | |
| Quattlebaum Terrance Lynn | -- | Chicago Title | |
| Quattlebaum Terrance Lynn | $147,900 | -- |
Source: Public Records
Mortgage History
| Date | Status | Borrower | Loan Amount |
|---|---|---|---|
| Open | Lindberg Denise | $328,000 | |
| Previous Owner | Quattlebaum Terrance Lynn | $182,000 |
Source: Public Records
Tax History Compared to Growth
Tax History
| Year | Tax Paid | Tax Assessment Tax Assessment Total Assessment is a certain percentage of the fair market value that is determined by local assessors to be the total taxable value of land and additions on the property. | Land | Improvement |
|---|---|---|---|---|
| 2024 | $7,629 | $923,000 | $469,000 | $454,000 |
| 2023 | $6,910 | $791,000 | $383,000 | $408,000 |
| 2022 | $6,184 | $990,000 | $456,000 | $534,000 |
| 2021 | $5,718 | $681,000 | $332,000 | $349,000 |
| 2020 | $5,581 | $574,000 | $275,000 | $299,000 |
| 2018 | $4,720 | $504,000 | $233,000 | $271,000 |
| 2017 | $4,296 | $449,000 | $208,000 | $241,000 |
| 2016 | $4,126 | $425,000 | $197,000 | $228,000 |
| 2015 | $3,956 | $402,000 | $187,000 | $215,000 |
| 2014 | -- | $371,000 | $170,000 | $201,000 |
| 2013 | -- | $244,000 | $140,000 | $104,000 |
Source: Public Records
Map
Nearby Homes
- 8427 NE 144th Place
- 8746 NE 144th Ct
- 8328 NE 148th Place
- 14911 84th Ave NE
- 14132 74th Place NE Unit 16D
- 8801 NE 140th Place
- 7728 NE 151st Ln
- 15031 78th Ave NE
- 15115 78th Ave NE
- 14020 Juanita Dr NE Unit B3
- 9109 NE 141st Place
- 8535 NE 136th St
- 9008 NE 138th Place
- 14009 91st Place NE
- 15505 81st Ave NE
- 8907 NE 152nd Place
- 14933 73rd Ave NE
- 16 Xxx 76th Place NE
- 7609 NE 155th St
- 13603 88th Place NE
- 14236 82nd Ave NE
- 14230 82nd Ave NE
- 14230 82nd Ave NE
- 8203 NE 143rd Place
- 8203 NE 143rd Place
- 8215 NE 143rd Place
- 14231 82nd Ave NE
- 14222 82nd Ave NE
- 14222 82nd Ave NE
- 14231 82nd Ave NE
- 8300 NE 143rd St
- 14237 82nd Ave NE
- 14237 82nd Ave NE
- 8126 NE 142nd Place
- 8126 NE 142nd Place
- 8300 NE 143rd St
- 14245 82nd Ave NE
- 8223 NE 143rd Place
- 14245 82nd Ave NE
- 8304 NE 143rd St