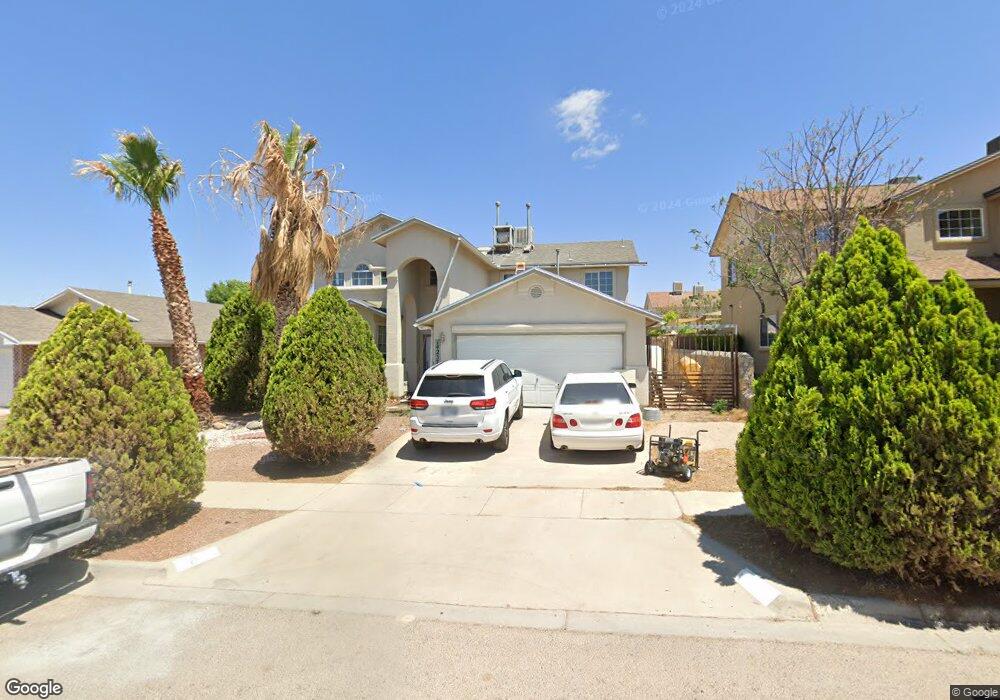
14237 Desert Ash Dr Horizon City, TX 79928
Estimated Value: $238,000 - $260,000
3
Beds
3
Baths
2,048
Sq Ft
$124/Sq Ft
Est. Value
About This Home
This home is located at 14237 Desert Ash Dr, Horizon City, TX 79928 and is currently estimated at $254,068, approximately $124 per square foot. 14237 Desert Ash Dr is a home located in El Paso County with nearby schools including Desert Hills Elementary School, Horizon Middle School, and Horizon High School.
Ownership History
Date
Name
Owned For
Owner Type
Purchase Details
Closed on
Nov 29, 2016
Sold by
Bencomo Federico Valenzuela and Valenzuela Maria Ybel
Bought by
Lopez Joel J
Current Estimated Value
Home Financials for this Owner
Home Financials are based on the most recent Mortgage that was taken out on this home.
Original Mortgage
$124,643
Outstanding Balance
$100,585
Interest Rate
3.5%
Mortgage Type
FHA
Estimated Equity
$153,483
Purchase Details
Closed on
Mar 28, 2008
Sold by
Gomez Avelino and Gomez Guillermina
Bought by
Bencomo Federico Valenzuela and Valenzuela Maria Ybel
Purchase Details
Closed on
Jul 23, 2004
Sold by
Classic Ventures Inc
Bought by
Gomez Avelino
Home Financials for this Owner
Home Financials are based on the most recent Mortgage that was taken out on this home.
Original Mortgage
$78,950
Interest Rate
6.3%
Mortgage Type
Purchase Money Mortgage
Create a Home Valuation Report for This Property
The Home Valuation Report is an in-depth analysis detailing your home's value as well as a comparison with similar homes in the area
Home Values in the Area
Average Home Value in this Area
Purchase History
| Date | Buyer | Sale Price | Title Company |
|---|---|---|---|
| Lopez Joel J | -- | None Available | |
| Bencomo Federico Valenzuela | -- | None Available | |
| Gomez Avelino | -- | -- |
Source: Public Records
Mortgage History
| Date | Status | Borrower | Loan Amount |
|---|---|---|---|
| Open | Lopez Joel J | $124,643 | |
| Previous Owner | Gomez Avelino | $78,950 |
Source: Public Records
Tax History Compared to Growth
Tax History
| Year | Tax Paid | Tax Assessment Tax Assessment Total Assessment is a certain percentage of the fair market value that is determined by local assessors to be the total taxable value of land and additions on the property. | Land | Improvement |
|---|---|---|---|---|
| 2025 | $5,248 | $219,398 | -- | -- |
| 2024 | $5,248 | $199,453 | -- | -- |
| 2023 | $4,573 | $181,321 | $0 | $0 |
| 2022 | $5,345 | $164,837 | $0 | $0 |
| 2021 | $5,347 | $182,149 | $21,115 | $161,034 |
| 2020 | $4,732 | $136,229 | $21,115 | $115,114 |
| 2018 | $4,429 | $131,961 | $21,115 | $110,846 |
| 2017 | $4,151 | $125,016 | $21,115 | $103,901 |
| 2016 | $4,151 | $125,016 | $21,115 | $103,901 |
| 2015 | $4,329 | $125,016 | $21,115 | $103,901 |
| 2014 | $4,329 | $137,029 | $21,115 | $115,914 |
Source: Public Records
Map
Nearby Homes
- 14204 Desert Sage Dr
- 14277 Desert Ash Dr
- 729 Paseo Astuto Place
- 725 Paseo Astuto Place
- 721 Paseo Astuto Place
- 717 Paseo Astuto Place
- 712 Paseo Astuto Place
- 713 Paseo Del Agua St
- 708 Paseo Astuto Place
- 713 Paseo Astuto Place
- 705 Paseo Astuto Place
- 709 Paseo Astuto Place
- 700 Paseo Del Agua St
- 757 Desert Star Dr
- 761 Desert Star Dr
- 753 Desert Silver Dr
- 14012 Paseo Aves Ave
- 760 Desert Ash Dr
- 14237 Desert Stone Dr
- 729 Paseo Del Agua St
- 14237 Desert Ash Dr
- 14241 Desert Ash Dr
- 14233 Desert Ash Dr
- 14245 Desert Ash Dr
- 14229 Desert Ash Dr
- 14232 Desert Sage Dr
- 14232 Desert Sage Dr Unit 1
- 14236 Desert Sage Dr
- 14236 Desert Sage Dr
- 14228 Desert Sage Dr
- 14228 Desert Sage Dr Unit 1
- 14224 Desert Sage Dr
- 14240 Desert Sage Dr
- 14240 Desert Sage Dr (4 Pct Comm)
- 14249 Desert Ash Dr
- 14249 Desert Ash Dr Unit none
- 14225 Desert Ash Dr
- 14236 Desert Ash Dr
- 14240 Desert Ash Dr
- 14232 Desert Ash Dr