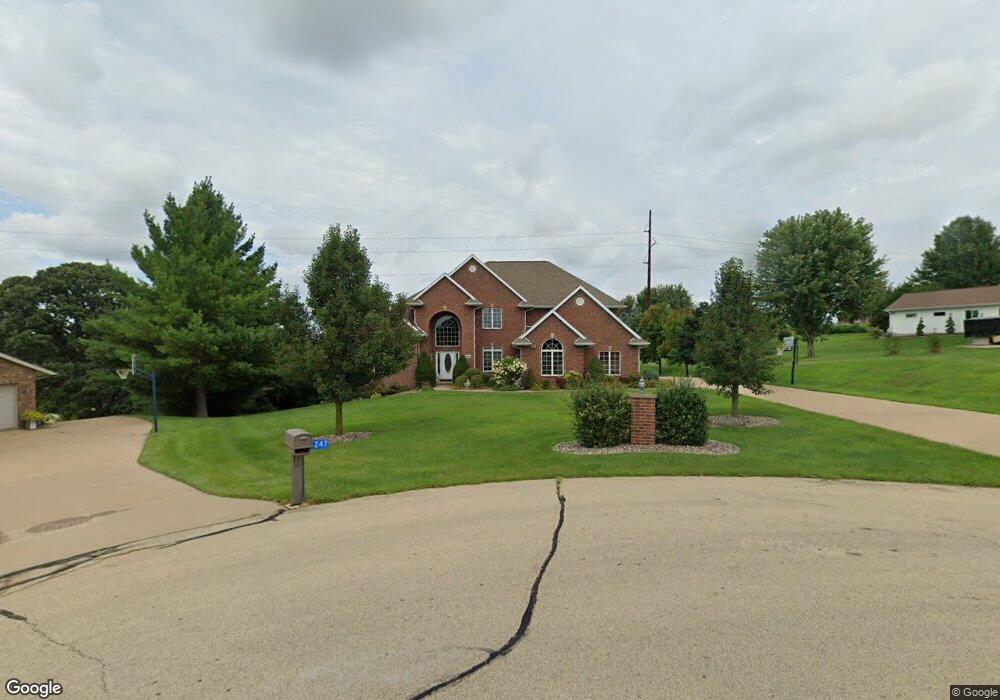
14239 Augusta Ct Dubuque, IA 52002
Estimated Value: $699,000 - $855,000
--
Bed
5
Baths
2,592
Sq Ft
$288/Sq Ft
Est. Value
About This Home
This home is located at 14239 Augusta Ct, Dubuque, IA 52002 and is currently estimated at $746,078, approximately $287 per square foot. 14239 Augusta Ct is a home located in Dubuque County with nearby schools including John Kennedy Elementary School, Eleanor Roosevelt Middle School, and Hempstead High School.
Ownership History
Date
Name
Owned For
Owner Type
Purchase Details
Closed on
Oct 28, 2016
Sold by
Marks Curtis J and Marks Catherine M
Bought by
Helle Christopher M and Helle Michelle M
Current Estimated Value
Purchase Details
Closed on
Sep 24, 2012
Sold by
Dietz Leo J and Dietz Ariene M
Bought by
Woodmoor Corporation Ii
Purchase Details
Closed on
Jun 28, 2006
Sold by
Advanced Custom Builders Llc
Bought by
Nguyen Sau and Tran Tuyen Kim
Home Financials for this Owner
Home Financials are based on the most recent Mortgage that was taken out on this home.
Original Mortgage
$200,000
Interest Rate
6.72%
Mortgage Type
New Conventional
Purchase Details
Closed on
Apr 19, 2006
Sold by
Dietz Leo J and Dietz Arlene M
Bought by
Woodmoor Corporation
Purchase Details
Closed on
Apr 28, 2005
Sold by
Hoppman Larry P and Hoppman Cindy J
Bought by
Noack Jeffrey J
Create a Home Valuation Report for This Property
The Home Valuation Report is an in-depth analysis detailing your home's value as well as a comparison with similar homes in the area
Home Values in the Area
Average Home Value in this Area
Purchase History
| Date | Buyer | Sale Price | Title Company |
|---|---|---|---|
| Helle Christopher M | -- | Attorney | |
| Woodmoor Corporation Ii | $7,000 | None Available | |
| Nguyen Sau | $400,000 | None Available | |
| Advanced Custom Builders Llc | $500 | None Available | |
| Woodmoor Corporation | $6,000 | None Available | |
| Noack Jeffrey J | $43,000 | None Available |
Source: Public Records
Mortgage History
| Date | Status | Borrower | Loan Amount |
|---|---|---|---|
| Previous Owner | Nguyen Sau | $200,000 |
Source: Public Records
Tax History
| Year | Tax Paid | Tax Assessment Tax Assessment Total Assessment is a certain percentage of the fair market value that is determined by local assessors to be the total taxable value of land and additions on the property. | Land | Improvement |
|---|---|---|---|---|
| 2025 | $6,748 | $665,000 | $95,100 | $569,900 |
| 2024 | $6,748 | $587,300 | $86,500 | $500,800 |
| 2023 | $6,522 | $587,300 | $86,500 | $500,800 |
| 2022 | $6,362 | $477,040 | $76,600 | $400,440 |
| 2021 | $6,362 | $477,040 | $76,600 | $400,440 |
| 2020 | $6,264 | $438,460 | $72,960 | $365,500 |
| 2019 | $6,346 | $438,460 | $72,960 | $365,500 |
| 2018 | $6,188 | $427,080 | $53,580 | $373,500 |
| 2017 | $5,998 | $427,080 | $53,580 | $373,500 |
| 2016 | $5,998 | $393,890 | $51,000 | $342,890 |
| 2015 | $5,834 | $393,890 | $51,000 | $342,890 |
| 2014 | $5,342 | $374,490 | $48,400 | $326,090 |
Source: Public Records
Map
Nearby Homes
- 16161 Hales Mill Ct
- 14435 Mill Ridge Rd
- Lot 28 Elly Rose Ct
- 14368 Elly Rose Ct
- 5468 Park Place
- 14294 Keegan Ct
- 14368 Keegan Ct
- 0 Chavenelle Unit at Seippel Road
- 0 Chavenelle Unit 4050 Westmark Drive
- 5655 Sun Valley Dr
- 6100 Lynbrook Dr
- 2357 Briarwood Dr
- 2300 Antler Ridge Dr
- 4401 Barnwood Ln
- 4501 Ewing Dr
- 3697 Lasso Ct
- 2266 Antler Ridge Dr
- 4487 Ewing Dr
- 3665 Vintage Ln
- 4475 Ewing Dr
- 14247 Augusta Ct
- 14213 Augusta Ct
- 14248 Augusta Ct
- 14210 Augusta Ct
- 15943 Woodmoor Dr
- 14230 Augusta Ct
- 15969 Woodmoor Dr
- 14176 Starr Pass
- Lot 1 Keegan Ct
- Lot1 Keegan Dr
- 14210 Starr Pass
- 15913 Woodmoor Dr
- 16021 Woodmoor Dr
- Lot 8 Keegan Dr
- Lot 2 Keegan Ct
- Lot 6 Keegan Dr
- Lot 4 Keegan Ct
- 15873 Woodmoor Dr
- 15944 Woodmoor Dr
- Lot 2 Keegan Dr
Your Personal Tour Guide
Ask me questions while you tour the home.