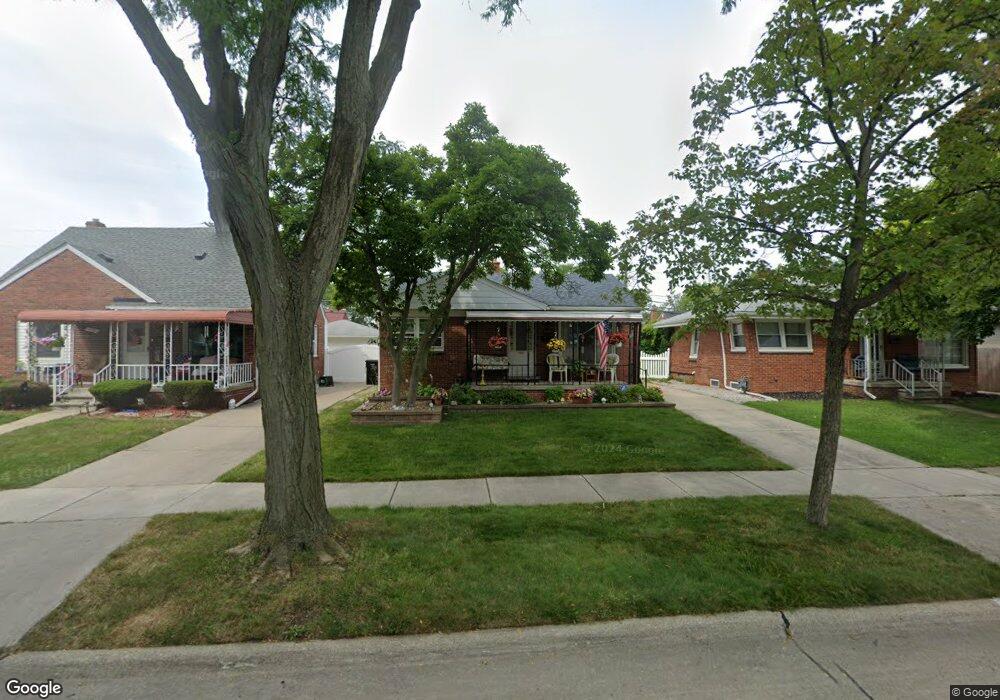
1424 11th St Wyandotte, MI 48192
Estimated Value: $148,517 - $216,000
--
Bed
--
Bath
739
Sq Ft
$242/Sq Ft
Est. Value
About This Home
This home is located at 1424 11th St, Wyandotte, MI 48192 and is currently estimated at $178,879, approximately $242 per square foot. 1424 11th St is a home located in Wayne County with nearby schools including Jefferson Elementary School, Woodrow Wilson School, and Roosevelt High School.
Ownership History
Date
Name
Owned For
Owner Type
Purchase Details
Closed on
Jul 20, 2022
Sold by
Abdo Dawn M
Bought by
Abdo Dawn M and Simmons Brittany Rose
Current Estimated Value
Purchase Details
Closed on
Jul 19, 2019
Sold by
Abdo Dawn M and Pappas Dawn M
Bought by
Abdo Dawn M and Abdo Steven G
Purchase Details
Closed on
Jun 14, 2011
Sold by
The Anthony Bojarski Jr Revocable Living
Bought by
Pappas Dawn M
Purchase Details
Closed on
Sep 18, 2006
Sold by
Bojarski Anthony J and Bojarski Martha
Bought by
Anthony Bojarski Jr Revocable Living Tr
Create a Home Valuation Report for This Property
The Home Valuation Report is an in-depth analysis detailing your home's value as well as a comparison with similar homes in the area
Home Values in the Area
Average Home Value in this Area
Purchase History
| Date | Buyer | Sale Price | Title Company |
|---|---|---|---|
| Abdo Dawn M | -- | None Listed On Document | |
| Abdo Dawn M | -- | None Available | |
| Pappas Dawn M | $31,830 | Title One Inc | |
| Anthony Bojarski Jr Revocable Living Tr | -- | None Available |
Source: Public Records
Tax History Compared to Growth
Tax History
| Year | Tax Paid | Tax Assessment Tax Assessment Total Assessment is a certain percentage of the fair market value that is determined by local assessors to be the total taxable value of land and additions on the property. | Land | Improvement |
|---|---|---|---|---|
| 2025 | $2,077 | $84,500 | $0 | $0 |
| 2024 | $2,077 | $77,200 | $0 | $0 |
| 2023 | $1,981 | $70,600 | $0 | $0 |
| 2022 | $2,295 | $63,100 | $0 | $0 |
| 2021 | $2,249 | $56,600 | $0 | $0 |
| 2020 | $2,218 | $50,700 | $0 | $0 |
| 2019 | $2,187 | $47,100 | $0 | $0 |
| 2018 | $1,746 | $47,300 | $0 | $0 |
| 2017 | $765 | $47,300 | $0 | $0 |
| 2016 | $2,112 | $43,000 | $0 | $0 |
| 2015 | $3,768 | $39,900 | $0 | $0 |
| 2013 | $3,650 | $36,500 | $0 | $0 |
| 2012 | $1,824 | $38,200 | $6,800 | $31,400 |
Source: Public Records
Map
Nearby Homes