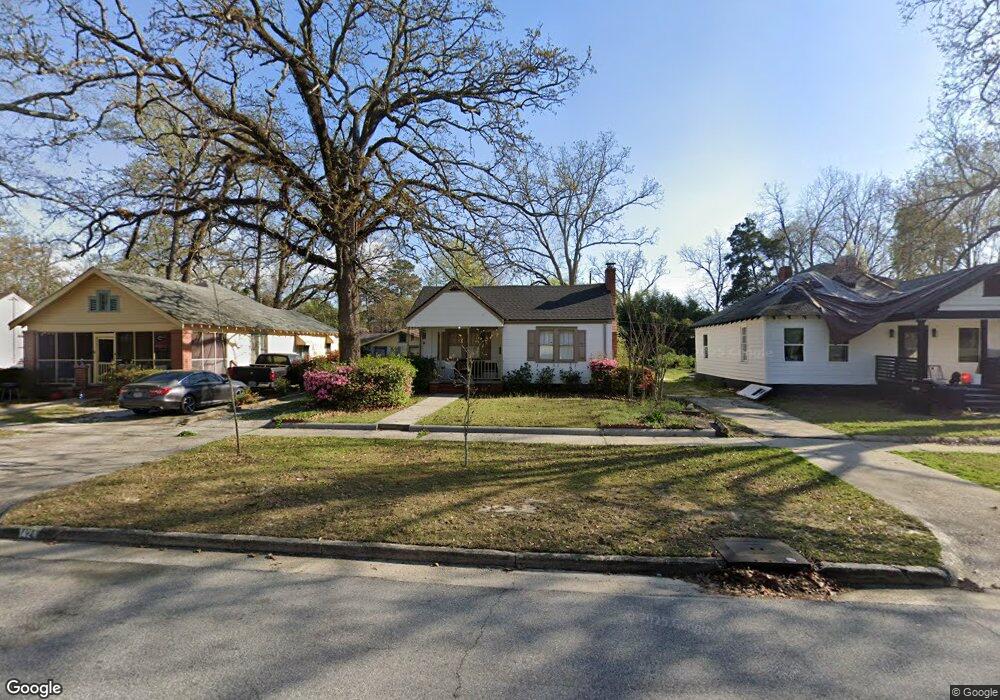
1424 22nd St Columbus, GA 31901
East Highlands NeighborhoodEstimated Value: $128,000 - $153,921
3
Beds
3
Baths
1,356
Sq Ft
$105/Sq Ft
Est. Value
About This Home
This home is located at 1424 22nd St, Columbus, GA 31901 and is currently estimated at $142,230, approximately $104 per square foot. 1424 22nd St is a home located in Muscogee County with nearby schools including Arnold Middle School, Jordan Vocational High School, and Wynnton Elementary School.
Ownership History
Date
Name
Owned For
Owner Type
Purchase Details
Closed on
Aug 16, 2016
Sold by
Martin J Douglas
Bought by
Renn Ricky Randell
Current Estimated Value
Home Financials for this Owner
Home Financials are based on the most recent Mortgage that was taken out on this home.
Original Mortgage
$68,633
Outstanding Balance
$54,351
Interest Rate
3.25%
Mortgage Type
FHA
Estimated Equity
$87,879
Purchase Details
Closed on
Sep 3, 2013
Sold by
Martin Douglas J
Bought by
G & M Kennon Properties Lllp
Create a Home Valuation Report for This Property
The Home Valuation Report is an in-depth analysis detailing your home's value as well as a comparison with similar homes in the area
Home Values in the Area
Average Home Value in this Area
Purchase History
| Date | Buyer | Sale Price | Title Company |
|---|---|---|---|
| Renn Ricky Randell | $69,900 | -- | |
| G & M Kennon Properties Lllp | -- | -- |
Source: Public Records
Mortgage History
| Date | Status | Borrower | Loan Amount |
|---|---|---|---|
| Open | Renn Ricky Randell | $68,633 |
Source: Public Records
Tax History Compared to Growth
Tax History
| Year | Tax Paid | Tax Assessment Tax Assessment Total Assessment is a certain percentage of the fair market value that is determined by local assessors to be the total taxable value of land and additions on the property. | Land | Improvement |
|---|---|---|---|---|
| 2025 | $538 | $35,168 | $6,232 | $28,936 |
| 2024 | $537 | $35,168 | $6,232 | $28,936 |
| 2023 | $22 | $35,168 | $6,232 | $28,936 |
| 2022 | $559 | $24,004 | $6,232 | $17,772 |
| 2021 | $553 | $24,752 | $6,232 | $18,520 |
| 2020 | $553 | $24,752 | $6,232 | $18,520 |
| 2019 | $557 | $24,752 | $6,232 | $18,520 |
| 2018 | $557 | $24,752 | $6,232 | $18,520 |
| 2017 | $560 | $26,928 | $6,232 | $20,696 |
| 2016 | $85 | $2,071 | $296 | $1,775 |
| 2015 | $34 | $2,071 | $296 | $1,775 |
| 2014 | $301 | $18,181 | $2,600 | $15,581 |
| 2013 | -- | $29,887 | $2,600 | $27,287 |
Source: Public Records
Map
Nearby Homes