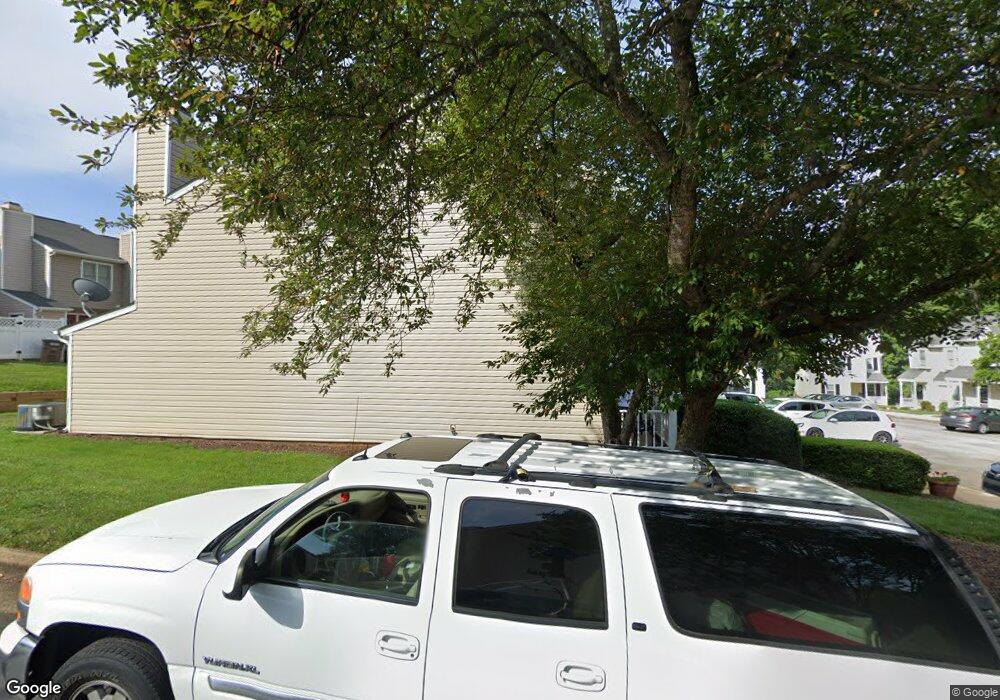
1424 Cimarron Pkwy Unit 42 Wake Forest, NC 27587
Estimated Value: $218,000 - $347,000
2
Beds
2
Baths
1,024
Sq Ft
$261/Sq Ft
Est. Value
About This Home
This home is located at 1424 Cimarron Pkwy Unit 42, Wake Forest, NC 27587 and is currently estimated at $267,690, approximately $261 per square foot. 1424 Cimarron Pkwy Unit 42 is a home located in Wake County with nearby schools including Forest Pines Drive Elementary School, Wake Forest-Rolesville Middle School, and Heritage High School.
Ownership History
Date
Name
Owned For
Owner Type
Purchase Details
Closed on
Mar 25, 2015
Sold by
Tice Heather
Bought by
Scott Donna A
Current Estimated Value
Home Financials for this Owner
Home Financials are based on the most recent Mortgage that was taken out on this home.
Original Mortgage
$92,857
Outstanding Balance
$71,666
Interest Rate
3.89%
Mortgage Type
New Conventional
Estimated Equity
$196,024
Purchase Details
Closed on
Aug 25, 2008
Sold by
Hurst Andrew James
Bought by
Tice Heather
Home Financials for this Owner
Home Financials are based on the most recent Mortgage that was taken out on this home.
Original Mortgage
$90,286
Interest Rate
6.61%
Mortgage Type
FHA
Purchase Details
Closed on
Mar 28, 2002
Sold by
Bennett Amanda N
Bought by
Hurst Sonja E
Create a Home Valuation Report for This Property
The Home Valuation Report is an in-depth analysis detailing your home's value as well as a comparison with similar homes in the area
Home Values in the Area
Average Home Value in this Area
Purchase History
| Date | Buyer | Sale Price | Title Company |
|---|---|---|---|
| Scott Donna A | $91,000 | None Available | |
| Tice Heather | $91,000 | None Available | |
| Hurst Sonja E | $80,000 | -- |
Source: Public Records
Mortgage History
| Date | Status | Borrower | Loan Amount |
|---|---|---|---|
| Open | Scott Donna A | $92,857 | |
| Previous Owner | Tice Heather | $90,286 |
Source: Public Records
Tax History Compared to Growth
Tax History
| Year | Tax Paid | Tax Assessment Tax Assessment Total Assessment is a certain percentage of the fair market value that is determined by local assessors to be the total taxable value of land and additions on the property. | Land | Improvement |
|---|---|---|---|---|
| 2025 | $2,155 | $223,173 | $60,000 | $163,173 |
| 2024 | $2,147 | $223,173 | $60,000 | $163,173 |
| 2023 | $1,582 | $134,388 | $22,000 | $112,388 |
| 2022 | $1,518 | $134,388 | $22,000 | $112,388 |
| 2021 | $1,492 | $134,388 | $22,000 | $112,388 |
| 2020 | $1,492 | $134,388 | $22,000 | $112,388 |
| 2019 | $1,154 | $91,415 | $14,000 | $77,415 |
| 2018 | $1,094 | $91,415 | $14,000 | $77,415 |
| 2017 | $1,058 | $91,415 | $14,000 | $77,415 |
| 2016 | $1,044 | $91,415 | $14,000 | $77,415 |
| 2015 | $1,046 | $90,409 | $16,000 | $74,409 |
| 2014 | $1,013 | $90,409 | $16,000 | $74,409 |
Source: Public Records
Map
Nearby Homes
- 1413 Cedar Branch Ct
- 1446 Cimarron Pkwy Unit 64
- 1451 Cimarron Pkwy
- 1454 Cimarron Pkwy
- 0 S Main St
- 319 Tillamook Dr
- 1305 Ecola Valley Ct
- 1301 Ecola Valley Ct
- 1758 Rowsby Ct
- 262 Tillamook Dr
- 1240 Miracle Dr
- 218 Forestville Rd
- 405 Grove Overlook Ln Unit 200
- 405 Grove Overlook Ln Unit 100
- 1525 Reynolds Mill Rd
- 407 Grove Overlook Ln Unit 100
- 401 Grove Overlook Ln Unit 100
- 412 Gaston Park Ln Unit 100
- 403 Grove Overlook Ln Unit 100
- 407 Grove Overlook Ln Unit 200
- 1424 #46 Cimarron Pkwy
- 1424-43 Cimarron Pkwy
- 1424 #39 Cimarron Pkwy
- 1424-1 Cimarron Pkwy
- 1424 Cimarron Pkwy Unit 44
- 1424 Cimarron Pkwy Unit 45
- 1424 Cimarron Pkwy Unit 46
- 1424 Cimarron Pkwy Unit 47
- 1424 Cimarron Pkwy Unit 48
- 1424 Cimarron Pkwy Unit 49
- 1424 Cimarron Pkwy Unit 50
- 1424 Cimarron Pkwy Unit 51
- 1424 Cimarron Pkwy Unit 52
- 1424 Cimarron Pkwy Unit 43
- 1424 Cimarron Pkwy Unit 41
- 1424 Cimarron Pkwy Unit 40
- 1424 Cimarron Pkwy Unit 39
- 1424 Cimarron Pkwy Unit 1
- 1424 Cimarron Pkwy Unit 3
- 1424 Cimarron Pkwy Unit 2