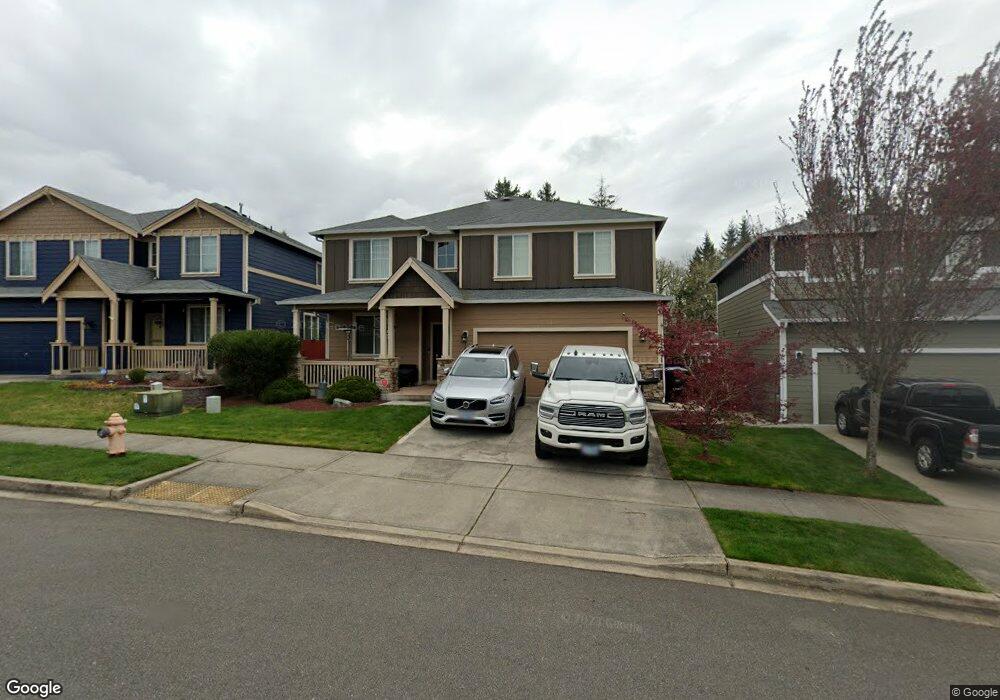
1424 Farina Loop SE Olympia, WA 98513
Meadows NeighborhoodEstimated Value: $589,113 - $630,000
4
Beds
3
Baths
3,115
Sq Ft
$196/Sq Ft
Est. Value
About This Home
This home is located at 1424 Farina Loop SE, Olympia, WA 98513 and is currently estimated at $609,528, approximately $195 per square foot. 1424 Farina Loop SE is a home located in Thurston County with nearby schools including Evergreen Forest Elementary School, Nisqually Middle School, and River Ridge High School.
Ownership History
Date
Name
Owned For
Owner Type
Purchase Details
Closed on
Apr 9, 2021
Sold by
Sabagala Yolanda and Sabagala Ronald
Bought by
Shah Vivek and Shah Nili
Current Estimated Value
Home Financials for this Owner
Home Financials are based on the most recent Mortgage that was taken out on this home.
Original Mortgage
$367,500
Outstanding Balance
$328,918
Interest Rate
3%
Mortgage Type
New Conventional
Estimated Equity
$280,610
Purchase Details
Closed on
Dec 28, 2011
Sold by
Freestone Gbs Union Mills Llc
Bought by
Sabagala Yolanda and Sabagala Ronald
Home Financials for this Owner
Home Financials are based on the most recent Mortgage that was taken out on this home.
Original Mortgage
$336,858
Interest Rate
3.94%
Mortgage Type
VA
Create a Home Valuation Report for This Property
The Home Valuation Report is an in-depth analysis detailing your home's value as well as a comparison with similar homes in the area
Home Values in the Area
Average Home Value in this Area
Purchase History
| Date | Buyer | Sale Price | Title Company |
|---|---|---|---|
| Shah Vivek | $490,000 | Fatco | |
| Sabagala Yolanda | $336,858 | Chicago Title Company |
Source: Public Records
Mortgage History
| Date | Status | Borrower | Loan Amount |
|---|---|---|---|
| Open | Shah Vivek | $367,500 | |
| Previous Owner | Sabagala Yolanda | $336,858 |
Source: Public Records
Tax History
| Year | Tax Paid | Tax Assessment Tax Assessment Total Assessment is a certain percentage of the fair market value that is determined by local assessors to be the total taxable value of land and additions on the property. | Land | Improvement |
|---|---|---|---|---|
| 2025 | $5,188 | $596,500 | $135,300 | $461,200 |
| 2024 | $5,188 | $550,500 | $130,100 | $420,400 |
| 2023 | $5,188 | $532,400 | $108,800 | $423,600 |
| 2022 | $5,628 | $511,100 | $58,700 | $452,400 |
| 2021 | $5,117 | $474,500 | $67,200 | $407,300 |
| 2020 | $4,754 | $401,800 | $64,800 | $337,000 |
| 2019 | $4,156 | $384,000 | $57,500 | $326,500 |
| 2018 | $4,745 | $342,600 | $44,900 | $297,700 |
| 2017 | $4,240 | $318,500 | $43,700 | $274,800 |
| 2016 | $4,362 | $340,850 | $44,150 | $296,700 |
| 2014 | -- | $322,250 | $44,150 | $278,100 |
Source: Public Records
Map
Nearby Homes
- 8727 Pacific Ave SE
- 1546 Farina Loop SE
- 8938 Milbanke Dr SE
- 1503 Milbanke Dr SE
- 8320 16th Ave SE
- 1731 Mcallister Ct SE
- 8705 Fenwick Loop SE
- 815 Gregory Way SE
- 2131 Huntington Loop SE
- 8124 Hidden Valley Dr SE
- 8905 Coos Dr SE
- 9245 Piperhill Dr SE
- 1215 Gadwell Ct SE
- 8124 18th Ln SE Unit 142
- 1823 Cranberry Ln SE
- 871 Spruce St SE
- 1434 Goldenrod Dr SE
- 9148 Bedington Dr SE
- 1345 Rockcress Dr SE
- 2526 Acer Loop SE
- 1426 Farina Loop SE
- 1428 Farina Loop SE
- 1427 Farina Loop SE
- 1430 Farina Loop SE
- 1429 Farina Loop SE
- 1425 Farina Loop SE
- 1431 Farina Loop SE
- 1432 Farina Loop SE
- 1423 Farina Loop SE
- 1433 Farina Loop SE
- 1440 Bedstone Dr SE
- 1434 Farina Loop SE
- 1421 Farina Loop SE
- 8729 Pacific Ave SE
- 1435 Farina Loop SE
- 1418 Farina Loop SE
- 1448 Bedstone Dr SE
- 1436 Farina Loop SE
- 1432 Bedstone Dr SE