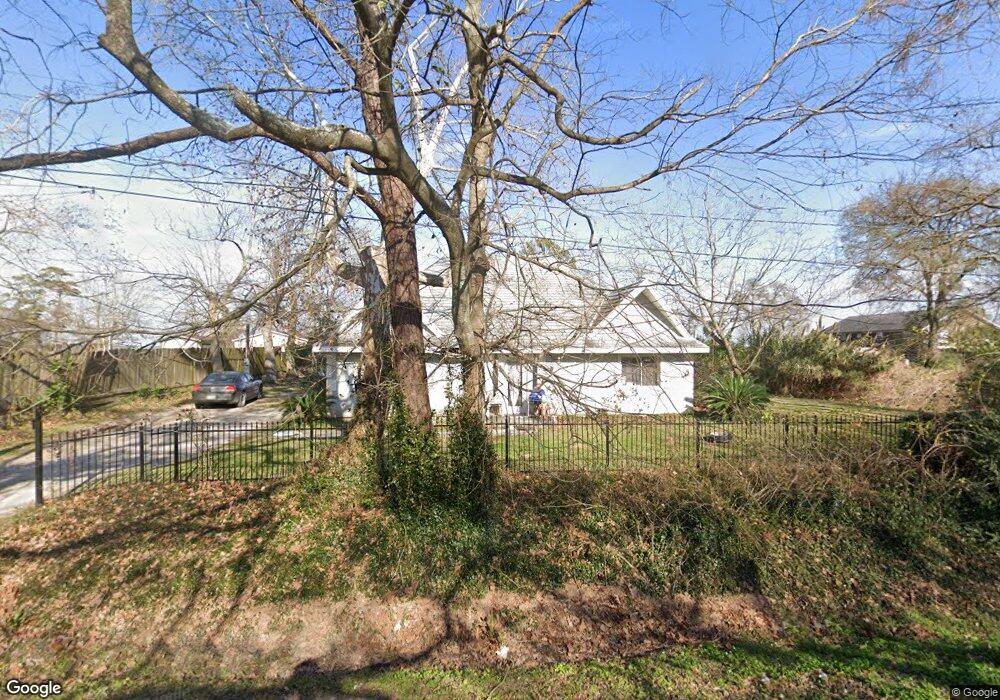
1424 Park Dr Channelview, TX 77530
Estimated Value: $291,000 - $409,000
4
Beds
5
Baths
2,372
Sq Ft
$145/Sq Ft
Est. Value
About This Home
This home is located at 1424 Park Dr, Channelview, TX 77530 and is currently estimated at $344,595, approximately $145 per square foot. 1424 Park Dr is a home located in Harris County with nearby schools including Channelview High School.
Ownership History
Date
Name
Owned For
Owner Type
Purchase Details
Closed on
Dec 22, 2023
Sold by
Rex Stephanie
Bought by
Rex Danny
Current Estimated Value
Purchase Details
Closed on
May 21, 2004
Sold by
Fallin Richard W
Bought by
Rex Danny L and Rex Stephanie J
Home Financials for this Owner
Home Financials are based on the most recent Mortgage that was taken out on this home.
Original Mortgage
$103,000
Interest Rate
6.12%
Mortgage Type
Seller Take Back
Purchase Details
Closed on
Aug 5, 2003
Sold by
Ochs Steven D and Ochs Elizabeth R
Bought by
Fallin Richard W
Purchase Details
Closed on
Nov 1, 2001
Sold by
Fallin Richard W
Bought by
Ochs Steven D and Ochs Elizabeth R
Home Financials for this Owner
Home Financials are based on the most recent Mortgage that was taken out on this home.
Original Mortgage
$106,500
Interest Rate
6.59%
Mortgage Type
Seller Take Back
Create a Home Valuation Report for This Property
The Home Valuation Report is an in-depth analysis detailing your home's value as well as a comparison with similar homes in the area
Home Values in the Area
Average Home Value in this Area
Purchase History
| Date | Buyer | Sale Price | Title Company |
|---|---|---|---|
| Rex Danny | -- | None Listed On Document | |
| Rex Danny L | -- | Fidelity National Title | |
| Fallin Richard W | $90,000 | -- | |
| Ochs Steven D | -- | -- |
Source: Public Records
Mortgage History
| Date | Status | Borrower | Loan Amount |
|---|---|---|---|
| Previous Owner | Rex Danny L | $103,000 | |
| Previous Owner | Ochs Steven D | $106,500 |
Source: Public Records
Tax History Compared to Growth
Tax History
| Year | Tax Paid | Tax Assessment Tax Assessment Total Assessment is a certain percentage of the fair market value that is determined by local assessors to be the total taxable value of land and additions on the property. | Land | Improvement |
|---|---|---|---|---|
| 2025 | $5,281 | $334,206 | $192,368 | $141,838 |
| 2024 | $5,281 | $292,769 | $168,322 | $124,447 |
| 2023 | $5,281 | $312,852 | $168,322 | $144,530 |
| 2022 | $5,459 | $266,597 | $144,276 | $122,321 |
| 2021 | $5,276 | $249,122 | $96,680 | $152,442 |
| 2020 | $3,588 | $162,952 | $87,012 | $75,940 |
| 2019 | $3,077 | $152,433 | $87,012 | $65,421 |
| 2018 | $2,953 | $125,062 | $87,012 | $38,050 |
| 2017 | $2,546 | $125,062 | $60,425 | $64,637 |
| 2016 | $2,315 | $121,700 | $60,425 | $61,275 |
| 2015 | $1,626 | $109,256 | $60,425 | $48,831 |
| 2014 | $1,626 | $105,587 | $60,425 | $45,162 |
Source: Public Records
Map
Nearby Homes
- 17119 Water Oak Dr
- 16600 Laurelwood Dr
- 00 Laurelwood Dr
- 16811 Forest Trail Dr
- 17102 River Rd
- 16725 Shady Ln
- 16736 Forest Trail Dr
- 0 Laurelwood Dr Unit 43034610
- 17513 River Rd
- 16326 Bear Bayou Dr
- 16931 Avenue B
- 17202 Meadowbrook Dr
- 17325 River Rd
- 16219 Bear Bayou 1 2 Dr
- 17427 Moreland Dr
- 16121 Bear Bayou Dr Unit 13
- 1211 Pecan St
- 17512 River Rd
- 16134 Palm St
- 16809 Market St