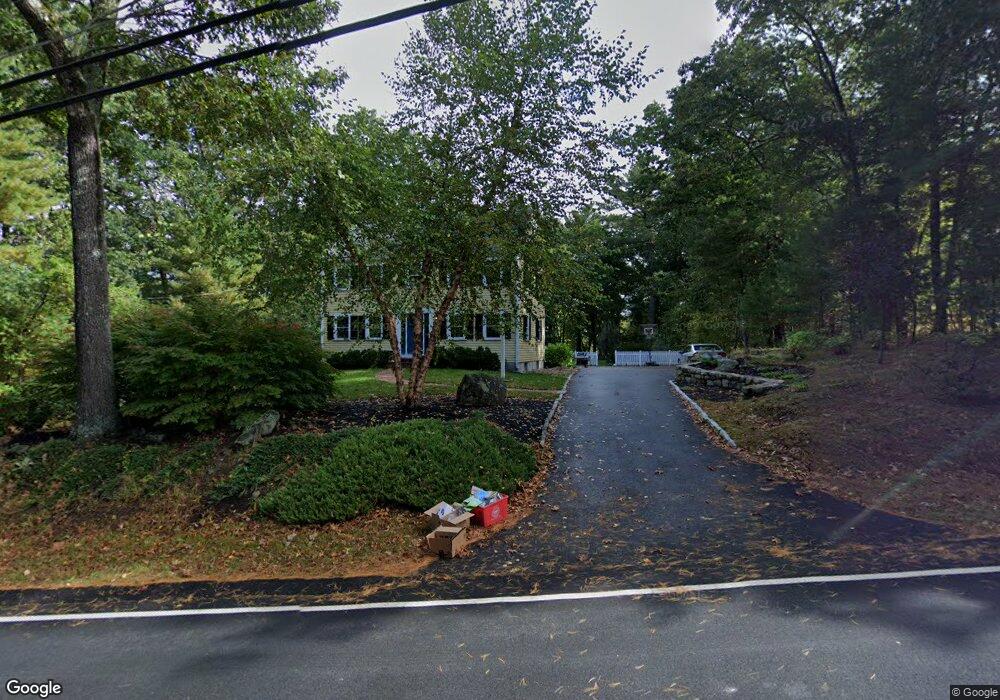
1424 Salem St North Andover, MA 01845
Estimated Value: $875,000 - $1,000,000
4
Beds
3
Baths
2,136
Sq Ft
$436/Sq Ft
Est. Value
About This Home
This home is located at 1424 Salem St, North Andover, MA 01845 and is currently estimated at $931,516, approximately $436 per square foot. 1424 Salem St is a home located in Essex County with nearby schools including Annie L Sargent Elementary School, North Andover Middle School, and North Andover High School.
Ownership History
Date
Name
Owned For
Owner Type
Purchase Details
Closed on
Aug 1, 2005
Sold by
Dowling Robert D and Dowling Carolyn O
Bought by
Hall Kerri and Hall John M
Current Estimated Value
Home Financials for this Owner
Home Financials are based on the most recent Mortgage that was taken out on this home.
Original Mortgage
$434,000
Interest Rate
5.67%
Mortgage Type
Purchase Money Mortgage
Purchase Details
Closed on
Feb 26, 1999
Sold by
Obrien Michael J
Bought by
Dowling Robert D
Purchase Details
Closed on
May 18, 1993
Sold by
Salisbury Charles A
Bought by
Obrien Michael J
Create a Home Valuation Report for This Property
The Home Valuation Report is an in-depth analysis detailing your home's value as well as a comparison with similar homes in the area
Home Values in the Area
Average Home Value in this Area
Purchase History
| Date | Buyer | Sale Price | Title Company |
|---|---|---|---|
| Hall Kerri | $542,500 | -- | |
| Dowling Robert D | $310,000 | -- | |
| Obrien Michael J | $215,000 | -- | |
| Hall Kerri | $542,500 | -- | |
| Dowling Robert D | $310,000 | -- | |
| Obrien Michael J | $215,000 | -- |
Source: Public Records
Mortgage History
| Date | Status | Borrower | Loan Amount |
|---|---|---|---|
| Open | Obrien Michael J | $351,000 | |
| Closed | Hall Kerri | $434,000 |
Source: Public Records
Tax History Compared to Growth
Tax History
| Year | Tax Paid | Tax Assessment Tax Assessment Total Assessment is a certain percentage of the fair market value that is determined by local assessors to be the total taxable value of land and additions on the property. | Land | Improvement |
|---|---|---|---|---|
| 2025 | $9,114 | $809,400 | $413,900 | $395,500 |
| 2024 | $8,616 | $776,900 | $392,100 | $384,800 |
| 2023 | $8,130 | $664,200 | $331,200 | $333,000 |
| 2022 | $7,920 | $585,400 | $300,700 | $284,700 |
| 2021 | $7,588 | $535,500 | $272,400 | $263,100 |
| 2020 | $7,358 | $535,500 | $272,400 | $263,100 |
| 2019 | $7,181 | $535,500 | $272,400 | $263,100 |
| 2018 | $7,781 | $535,500 | $272,400 | $263,100 |
| 2017 | $6,964 | $487,700 | $213,500 | $274,200 |
| 2016 | $6,613 | $463,400 | $212,200 | $251,200 |
| 2015 | $6,697 | $465,400 | $208,700 | $256,700 |
Source: Public Records
Map
Nearby Homes
- 453 Forest St
- 54 Sterling Ln
- 30 Sherwood Dr
- 42 Olympic Ln
- 82 Raleigh Tavern Ln
- 105 Weyland Cir
- 851 Forest St
- 194 Olympic Ln
- 125 Lancaster Rd
- 80 Compass Point Unit 80
- 155 Duncan Dr
- 127 Tucker Farm Rd
- 480 Sharpners Pond Rd
- 590 Foster St
- 50 Rocky Brook Rd
- 120 Gray St
- 53 Old Cart Way
- 75 Thistle Rd
- 43 Mill Rd
- 238 Essex St