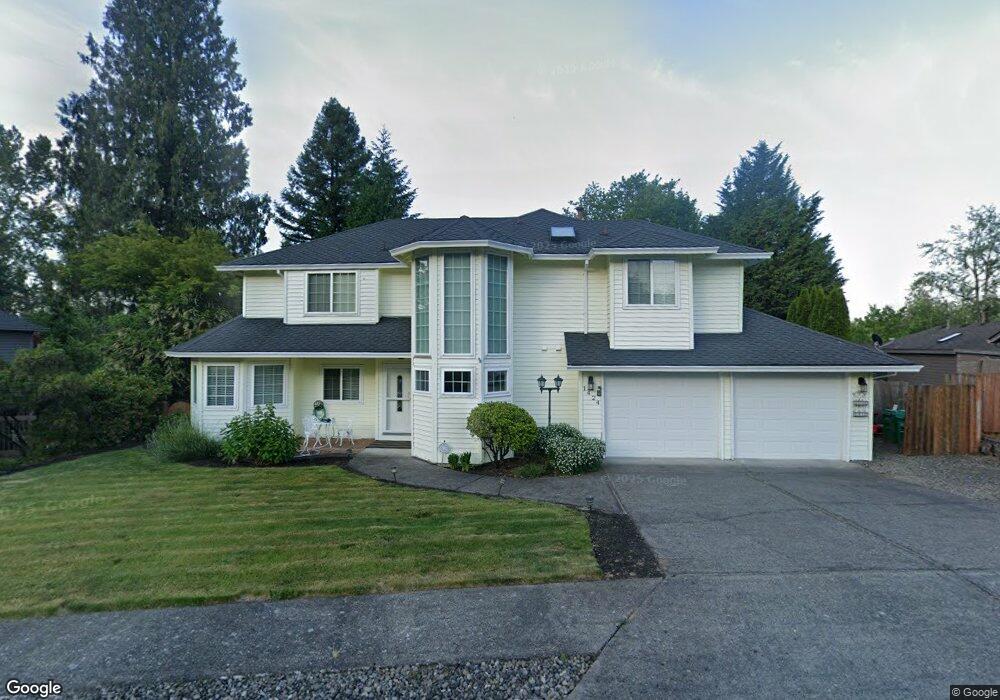
1424 SE Linden Ct Gresham, OR 97080
Gresham Butte NeighborhoodEstimated Value: $525,000 - $575,027
3
Beds
4
Baths
1,866
Sq Ft
$293/Sq Ft
Est. Value
About This Home
This home is located at 1424 SE Linden Ct, Gresham, OR 97080 and is currently estimated at $546,257, approximately $292 per square foot. 1424 SE Linden Ct is a home located in Multnomah County with nearby schools including East Gresham Elementary School, Dexter McCarty Middle School, and Gresham High School.
Ownership History
Date
Name
Owned For
Owner Type
Purchase Details
Closed on
Aug 21, 2020
Sold by
Sugitani Masako
Bought by
Lapado Masako Sugitani and Lapado Gary
Current Estimated Value
Purchase Details
Closed on
Aug 2, 2010
Sold by
Smith Steven L and Sugitani Masako
Bought by
Sugitani Masako
Purchase Details
Closed on
Mar 22, 2010
Sold by
Smith Steven L
Bought by
Smith Steven L and Sugitani Masako
Home Financials for this Owner
Home Financials are based on the most recent Mortgage that was taken out on this home.
Original Mortgage
$243,000
Outstanding Balance
$149,105
Interest Rate
3.62%
Mortgage Type
New Conventional
Estimated Equity
$397,152
Purchase Details
Closed on
May 11, 2004
Sold by
Ujifusa Clark Kathleen S
Bought by
Smith Steven L and Sugitani Masako
Home Financials for this Owner
Home Financials are based on the most recent Mortgage that was taken out on this home.
Original Mortgage
$186,400
Interest Rate
5.5%
Mortgage Type
Purchase Money Mortgage
Create a Home Valuation Report for This Property
The Home Valuation Report is an in-depth analysis detailing your home's value as well as a comparison with similar homes in the area
Home Values in the Area
Average Home Value in this Area
Purchase History
We collect this data history from publicly available records. To have your information removed, we recommend requesting removal directly through your county’s website.
| Date | Buyer | Sale Price | Title Company |
|---|---|---|---|
| Lapado Masako Sugitani | -- | Accommodation | |
| Sugitani Masako | -- | None Available | |
| Smith Steven L | -- | Fidelity Title Company | |
| Smith Steven L | $233,000 | Fatco |
Source: Public Records
Mortgage History
We collect this data history from publicly available records. To have your information removed, we recommend requesting removal directly through your county’s website.
| Date | Status | Borrower | Loan Amount |
|---|---|---|---|
| Open | Smith Steven L | $243,000 | |
| Previous Owner | Smith Steven L | $186,400 |
Source: Public Records
Tax History
| Year | Tax Paid | Tax Assessment Tax Assessment Total Assessment is a certain percentage of the fair market value that is determined by local assessors to be the total taxable value of land and additions on the property. | Land | Improvement |
|---|---|---|---|---|
| 2025 | $6,958 | $341,930 | -- | -- |
| 2024 | $6,661 | $331,980 | -- | -- |
| 2023 | $6,069 | $322,320 | $0 | $0 |
| 2022 | $5,899 | $312,940 | $0 | $0 |
| 2021 | $5,750 | $303,830 | $0 | $0 |
| 2020 | $5,411 | $294,990 | $0 | $0 |
| 2019 | $5,269 | $286,400 | $0 | $0 |
| 2018 | $5,024 | $278,060 | $0 | $0 |
| 2017 | $4,820 | $269,970 | $0 | $0 |
| 2016 | $4,250 | $262,110 | $0 | $0 |
| 2015 | $4,158 | $254,480 | $0 | $0 |
| 2014 | $4,041 | $247,070 | $0 | $0 |
Source: Public Records
Map
Nearby Homes
- 1326 SE Linden Ct
- 511 SE 15th St
- 939 SE Roberts Ave
- 1918 SE Regner Rd
- 765 775 SE Roberts Ave
- 1494 SE Maple Loop
- 1485 SE 11th St
- 0 SW Miller Ct Unit 470855683
- 2571 SE Elliott Dr
- 1949 SE Palmquist Rd Unit 51
- 1949 SE Palmquist Rd Unit 91
- 1949 SE Palmquist Rd Unit 73
- 1949 SE Palmquist Rd Unit 121
- 2440 SE Regner Rd
- 2581 SE Morlan Way
- 415 SE Roberts Ave
- 647 SE Hogan Rd
- 2137 SE 15th Aly
- 1696 SE 26th Dr
- 2633 SE Vista Way
- 1432 SE Linden Ct
- 1632 SE Elliott Ave
- 1640 SE Elliott Ave
- 1412 SE Linden Ct
- 1650 SE Elliott Ave
- 1548 SE Elliott Ave
- 1411 SE Linden Ct
- 1637 SE Elliott Ave
- 1526 SE Elliott Ave
- 1629 SE Elliott Ave
- 1329 SE Linden Ct
- 1518 SE Elliott Ave
- 1613 SE Elliott Ave
- 1541 SE Elliott Ave
- 1314 SE Linden Ct
- 1317 SE Linden Ct
- 1537 SE Elliott Ave
- 1601 SE Elliott Ave
- 1502 SE Elliott Ave
- 1521 SE Elliott Ave
Your Personal Tour Guide
Ask me questions while you tour the home.