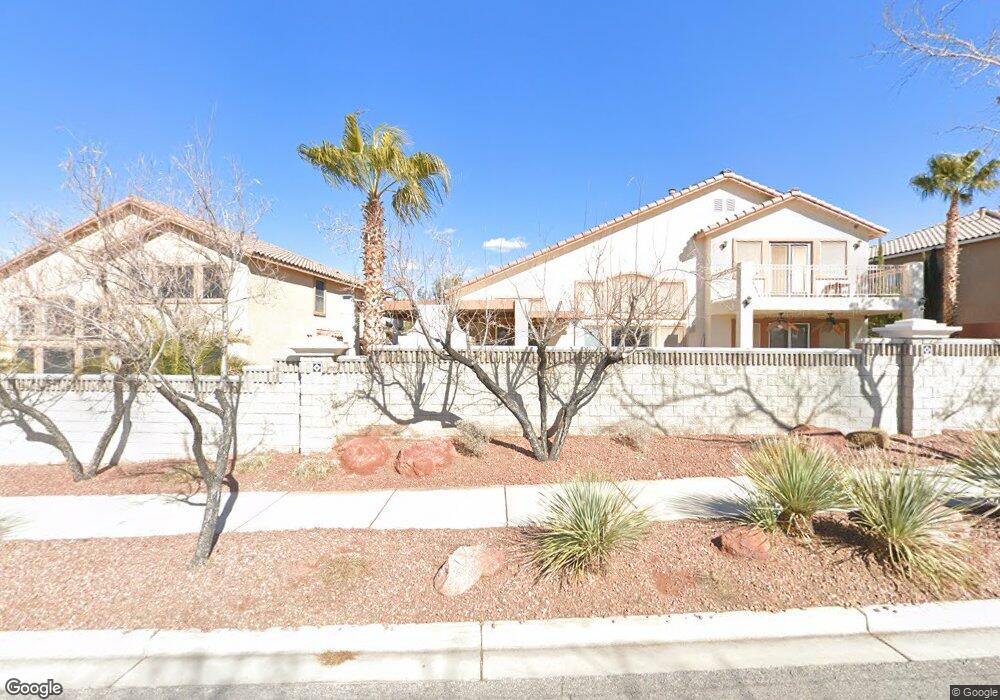
1424 Via Savona Dr Henderson, NV 89052
Seven Hills NeighborhoodEstimated Value: $922,000 - $1,079,000
4
Beds
3
Baths
3,474
Sq Ft
$286/Sq Ft
Est. Value
About This Home
This home is located at 1424 Via Savona Dr, Henderson, NV 89052 and is currently estimated at $994,370, approximately $286 per square foot. 1424 Via Savona Dr is a home located in Clark County with nearby schools including Elise L. Wolff Elementary School, Del E. Webb Middle School, and Coronado High School.
Ownership History
Date
Name
Owned For
Owner Type
Purchase Details
Closed on
Feb 21, 2023
Sold by
She Stanley Liwei and She Bei
Bought by
She Xu Family Trust and She
Current Estimated Value
Purchase Details
Closed on
Jan 31, 2014
Sold by
Xu Bei
Bought by
She Stanley L
Home Financials for this Owner
Home Financials are based on the most recent Mortgage that was taken out on this home.
Original Mortgage
$283,800
Interest Rate
4.45%
Mortgage Type
New Conventional
Purchase Details
Closed on
Feb 3, 2003
Sold by
Astoria Seven Hills 119 Llc
Bought by
Haynes Colin D and Haynes Deon A
Home Financials for this Owner
Home Financials are based on the most recent Mortgage that was taken out on this home.
Original Mortgage
$298,000
Interest Rate
5.97%
Create a Home Valuation Report for This Property
The Home Valuation Report is an in-depth analysis detailing your home's value as well as a comparison with similar homes in the area
Home Values in the Area
Average Home Value in this Area
Purchase History
| Date | Buyer | Sale Price | Title Company |
|---|---|---|---|
| She Xu Family Trust | -- | None Listed On Document | |
| She Stanley Liwei | -- | None Listed On Document | |
| She Stanley L | -- | Ticor Title Las Vegas | |
| She Stanley L | $473,000 | Ticor Title Las Vegas | |
| Haynes Colin D | $384,311 | First American Title Company |
Source: Public Records
Mortgage History
| Date | Status | Borrower | Loan Amount |
|---|---|---|---|
| Previous Owner | She Stanley L | $283,800 | |
| Previous Owner | Haynes Colin D | $298,000 |
Source: Public Records
Tax History Compared to Growth
Tax History
| Year | Tax Paid | Tax Assessment Tax Assessment Total Assessment is a certain percentage of the fair market value that is determined by local assessors to be the total taxable value of land and additions on the property. | Land | Improvement |
|---|---|---|---|---|
| 2025 | $5,880 | $233,481 | $77,000 | $156,481 |
| 2024 | $5,445 | $233,481 | $77,000 | $156,481 |
| 2023 | $3,625 | $214,921 | $67,200 | $147,721 |
| 2022 | $5,042 | $188,290 | $53,550 | $134,740 |
| 2021 | $4,668 | $176,555 | $48,300 | $128,255 |
| 2020 | $4,332 | $174,507 | $47,250 | $127,257 |
| 2019 | $4,060 | $166,777 | $41,650 | $125,127 |
| 2018 | $3,874 | $156,745 | $36,750 | $119,995 |
| 2017 | $4,446 | $153,359 | $31,850 | $121,509 |
| 2016 | $3,625 | $147,602 | $24,500 | $123,102 |
| 2015 | $3,619 | $128,386 | $21,000 | $107,386 |
| 2014 | $3,506 | $118,285 | $15,750 | $102,535 |
Source: Public Records
Map
Nearby Homes
- 1436 Via Merano St
- 3169 Crystal Moon Rd
- 1465 Via Savona Dr
- 1539 Misty Sky Dr
- 1376 European Dr
- 3088 Evening Mist Ave
- 1525 Via Salaria Ct Unit 1
- 3192 Tullio Way
- 3088 Via Flaminia Ct
- 1549 Peaceful Pine St Unit 3
- 1373 Dragon Rock Dr
- 1559 Via Della Scala
- 3068 Whispering Crest Dr
- 3084 Via Del Corso
- 1540 Sabatini Dr
- 1311 Rolling Sunset St
- 2940 Cimini Ct
- 3045 Evening Wind St
- 3071 Misty Moon Ave Unit 1
- 1353 Volturno Way
- 1420 Via Savona Dr Unit 2
- 1432 Via Savona Dr Unit n/a
- 1432 Via Savona Dr
- 3187 Via Passito Ct
- 1416 Via Savona Dr
- 1436 Via Savona Dr
- 1425 Via Savona Dr
- 1421 Via Savona Dr
- 1429 Via Savona Dr Unit 2
- 1417 Via Saona Dr
- 1417 Via Savona Dr
- 3183 Via Passito Ct
- 1408 Via Savona Dr
- 1433 Via Savona Dr Unit 2
- 1440 Via Savona Dr
- 1413 Via Savona Dr
- 3184 Via Passito Ct Unit na
- 3184 Via Passito Ct
- 3187 Cardino Ct