Estimated Value: $303,000 - $335,000
3
Beds
4
Baths
1,776
Sq Ft
$179/Sq Ft
Est. Value
About This Home
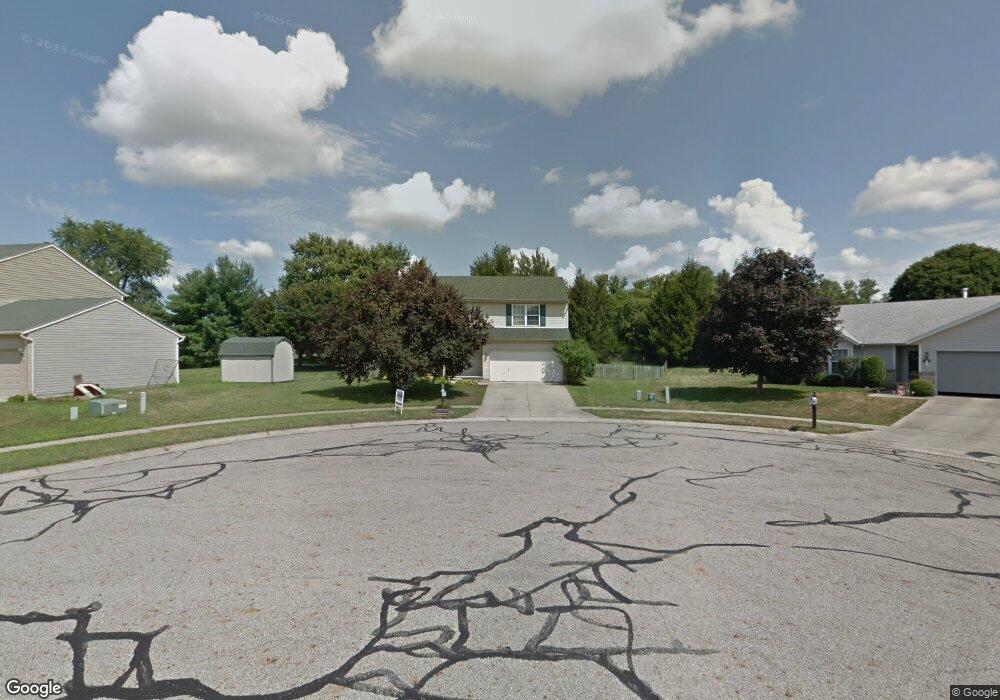
This home is located at 1425 E Kearney Ln, Xenia, OH 45385 and is currently estimated at $318,335, approximately $179 per square foot. 1425 E Kearney Ln is a home located in Greene County with nearby schools including Xenia High School and Summit Academy Community School for Alternative Learners - Xenia.
Ownership History
Date
Name
Owned For
Owner Type
Purchase Details
Closed on
Nov 25, 2014
Sold by
Ah4r Oh Llc
Bought by
Amh 2014 3 Borrower Llc
Current Estimated Value
Purchase Details
Closed on
Dec 19, 2012
Sold by
Phillps Scott D and Phillps Elizabeth M
Bought by
Ah4r Oh Llc
Purchase Details
Closed on
Sep 3, 2003
Sold by
Verge Joseph W and Verge Audrey A
Bought by
Phillips Scott D and Phillips Elizabeth M
Home Financials for this Owner
Home Financials are based on the most recent Mortgage that was taken out on this home.
Original Mortgage
$141,775
Interest Rate
5.97%
Mortgage Type
FHA
Purchase Details
Closed on
May 25, 1999
Sold by
Crossmann Communities Of Ohio
Bought by
Verge Joseph W and Verge Audrey A
Home Financials for this Owner
Home Financials are based on the most recent Mortgage that was taken out on this home.
Original Mortgage
$146,441
Interest Rate
6.92%
Mortgage Type
VA
Create a Home Valuation Report for This Property
The Home Valuation Report is an in-depth analysis detailing your home's value as well as a comparison with similar homes in the area
Home Values in the Area
Average Home Value in this Area
Purchase History
| Date | Buyer | Sale Price | Title Company |
|---|---|---|---|
| Amh 2014 3 Borrower Llc | -- | None Available | |
| Ah4r Oh Llc | $146,000 | Stewart Title Company | |
| Phillips Scott D | $288,000 | -- | |
| Verge Joseph W | $143,600 | -- |
Source: Public Records
Mortgage History
| Date | Status | Borrower | Loan Amount |
|---|---|---|---|
| Previous Owner | Phillips Scott D | $141,775 | |
| Previous Owner | Verge Joseph W | $146,441 |
Source: Public Records
Tax History Compared to Growth
Tax History
| Year | Tax Paid | Tax Assessment Tax Assessment Total Assessment is a certain percentage of the fair market value that is determined by local assessors to be the total taxable value of land and additions on the property. | Land | Improvement |
|---|---|---|---|---|
| 2024 | $3,636 | $84,970 | $23,330 | $61,640 |
| 2023 | $3,636 | $84,970 | $23,330 | $61,640 |
| 2022 | $3,187 | $63,520 | $15,550 | $47,970 |
| 2021 | $3,229 | $63,520 | $15,550 | $47,970 |
| 2020 | $3,094 | $63,520 | $15,550 | $47,970 |
| 2019 | $2,645 | $51,110 | $12,490 | $38,620 |
| 2018 | $2,655 | $51,110 | $12,490 | $38,620 |
| 2017 | $2,578 | $51,110 | $12,490 | $38,620 |
| 2016 | $2,611 | $49,330 | $12,490 | $36,840 |
| 2015 | $2,619 | $49,330 | $12,490 | $36,840 |
| 2014 | $2,508 | $49,330 | $12,490 | $36,840 |
Source: Public Records
Map
Nearby Homes
- 2784 Greystoke Dr
- 2821 Raxit Ct
- 0 Berkshire Dr Unit 942854
- 2540 Cornwall Dr
- 1318 Prem Place
- 2540 Jenny Marie Dr
- 2421 Louisiana Dr
- 1304 Baybury Ave
- 1298 Baybury Ave
- 2499 Jenny Marie Dr
- 1282 Baybury Ave
- 1248 Prem Place
- 2705 Tennessee Dr
- 1272 Baybury Ave
- 1292 Baybury Ave
- 1293 Baybury Ave
- 1213 Prem Place
- Chatham Plan at Edenbridge
- Bellamy Plan at Edenbridge
- Holcombe Plan at Edenbridge
- 940 Lower Bellbrook Rd
- 1435 E Kearney Ln
- 1415 E Kearney Ln
- 2749 Greystoke Dr
- 1405 E Kearney Ln
- 2739 Greystoke Dr
- 1440 E Kearney Ln
- 1410 E Kearney Ln
- 2731 Greystoke Dr
- 1420 E Kearney Ln
- 1402 E Kearney Ln
- 2752 Greystoke Dr
- 2746 Greystoke Dr
- 2762 Greystoke Dr
- 943 Lower Bellbrook Rd
- 2736 Greystoke Dr
- 980 Lower Bellbrook Rd
- 2723 Greystoke Dr
- 2779 Greystoke Dr
- 2768 Greystoke Dr