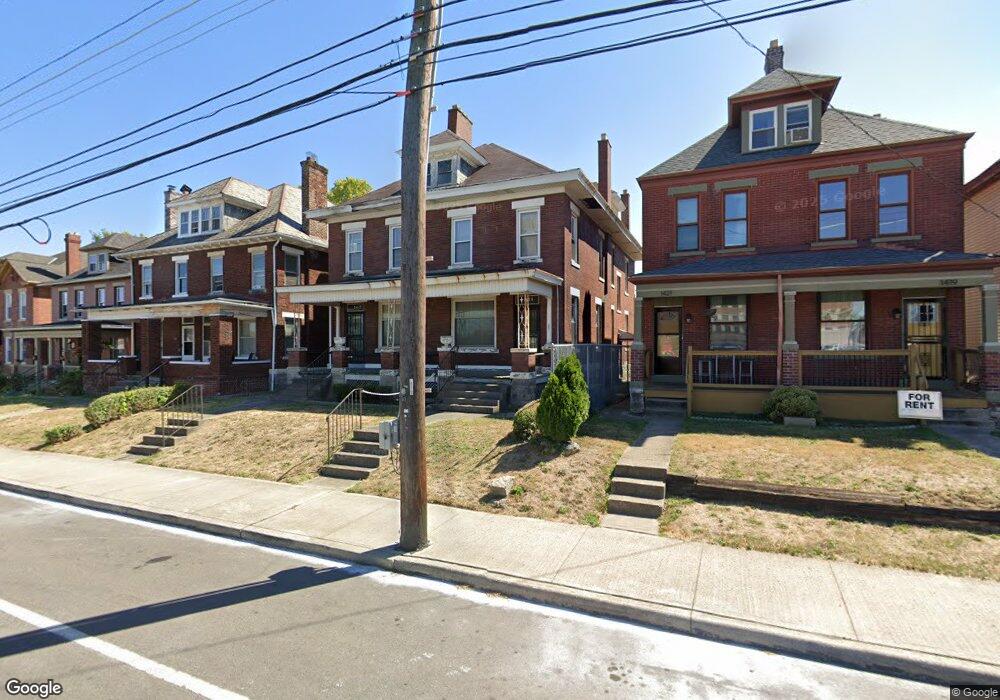
1425 E Long St Unit 427 Columbus, OH 43203
King-Lincoln Bronzeville NeighborhoodEstimated Value: $294,759 - $494,000
6
Beds
3
Baths
3,072
Sq Ft
$131/Sq Ft
Est. Value
About This Home
This home is located at 1425 E Long St Unit 427, Columbus, OH 43203 and is currently estimated at $402,190, approximately $130 per square foot. 1425 E Long St Unit 427 is a home located in Franklin County with nearby schools including Eastgate Elementary School, Champion Middle School, and East High School.
Ownership History
Date
Name
Owned For
Owner Type
Purchase Details
Closed on
Aug 11, 2020
Sold by
Travillion Sylvia Rahaman and Rahanan Sylvia A
Bought by
Saj Property Llc
Current Estimated Value
Purchase Details
Closed on
Mar 6, 2019
Sold by
Broadwater Maria C
Bought by
Travillion Sylvia Rahaman
Purchase Details
Closed on
Jan 23, 2019
Sold by
Jackson Terry L
Bought by
Travillion Sylvia Rahaman
Purchase Details
Closed on
Apr 18, 2013
Sold by
Jackson Roland N
Bought by
Travillion Sylvia A
Purchase Details
Closed on
May 27, 1999
Sold by
Estate Of Erma L Lash
Bought by
Jackson Terry L and Jackson Sylvia L
Purchase Details
Closed on
May 20, 1999
Sold by
Estate Of Erma L Lash
Bought by
Jackson Roland N
Purchase Details
Closed on
May 27, 1986
Bought by
Lash Erma J
Create a Home Valuation Report for This Property
The Home Valuation Report is an in-depth analysis detailing your home's value as well as a comparison with similar homes in the area
Home Values in the Area
Average Home Value in this Area
Purchase History
| Date | Buyer | Sale Price | Title Company |
|---|---|---|---|
| Saj Property Llc | -- | None Available | |
| Travillion Sylvia Rahaman | $30,100 | Trinity Columbus Ttl Agcy Bo | |
| Travillion Sylvia Rahaman | $30,100 | Trinity Columbus Ttl Agcy Bo | |
| Travillion Sylvia A | -- | None Available | |
| Jackson Terry L | -- | -- | |
| Jackson Roland N | -- | -- | |
| Lash Erma J | $6,700 | -- |
Source: Public Records
Tax History Compared to Growth
Tax History
| Year | Tax Paid | Tax Assessment Tax Assessment Total Assessment is a certain percentage of the fair market value that is determined by local assessors to be the total taxable value of land and additions on the property. | Land | Improvement |
|---|---|---|---|---|
| 2024 | $2,887 | $63,000 | $28,700 | $34,300 |
| 2023 | $5,515 | $121,870 | $28,700 | $93,170 |
| 2022 | $2,096 | $39,450 | $2,170 | $37,280 |
| 2021 | $2,100 | $39,450 | $2,170 | $37,280 |
| 2020 | $2,103 | $39,450 | $2,170 | $37,280 |
| 2019 | $1,966 | $31,610 | $1,750 | $29,860 |
| 2018 | $2,027 | $31,610 | $1,750 | $29,860 |
| 2017 | $2,131 | $31,610 | $1,750 | $29,860 |
| 2016 | $2,298 | $33,820 | $5,220 | $28,600 |
| 2015 | $2,092 | $33,820 | $5,220 | $28,600 |
| 2014 | $2,097 | $33,820 | $5,220 | $28,600 |
| 2013 | $985 | $32,200 | $4,970 | $27,230 |
Source: Public Records
Map
Nearby Homes
- 90-92 Burt St Unit 90
- 156 Winner Ave
- 1517 Hawthorne Ave
- 1318 E Long St
- 1304 E Long St
- 43 Winner Ave
- 1418 Phale D Hale Dr
- 1275 E Long St
- 1271 E Long St
- 39 Auburn Ave
- 241 Taylor Ave Unit 243
- 1593 Clifton Ave
- 290 Graham St
- 1620 E Broad St Unit 1108
- 280 Taylor Ave
- 220 Parkwood Ave Unit 222
- 1562 Richmond Ave
- 1622 Clifton Ave
- 320 Graham St
- 34 Woodland Ave
- 1431 E Long St Unit 433
- 1419 E Long St
- 1421 E Long St
- 1417 E Long St
- 90 Burt St Unit 92
- 90 Burt St Unit 90-92
- 90-92 Burt St
- 1435 E Long St Unit 437
- 1435 E Long St Unit 1437
- 86 Burt St Unit 88
- 86-88 Burt St
- 1413 E Long St Unit 415
- 1441 E Long St
- 80 Burt St
- 88 Burt St
- 1449 E Long St
- 1418 Eastwood Ave
- 1401 E Long St
- 1424 Eastwood Ave
- 1403 E Long St