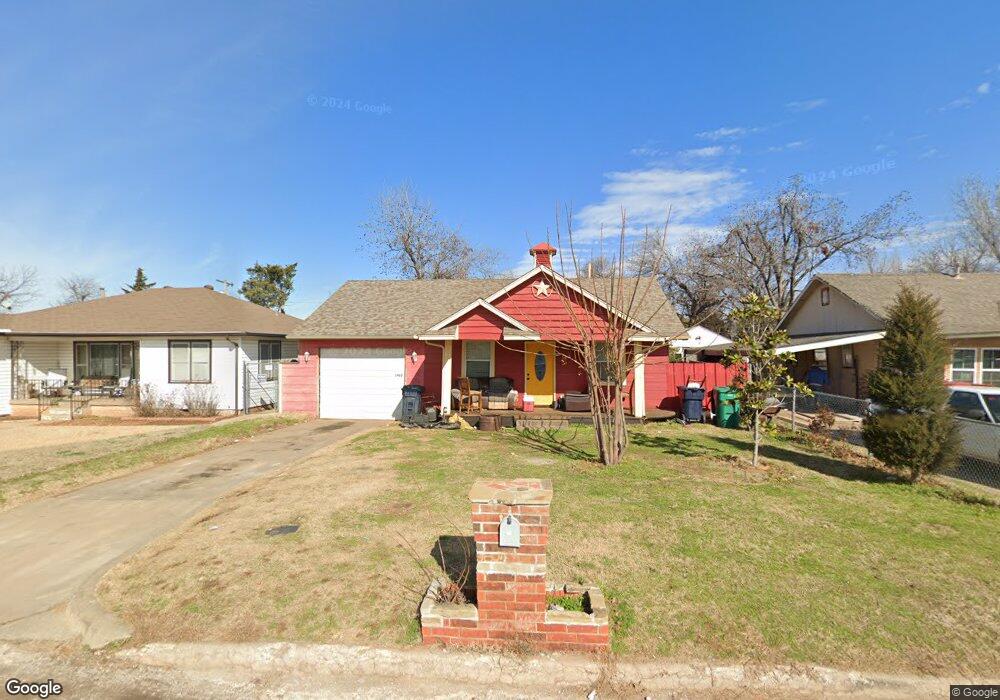
1425 SW 35th St Oklahoma City, OK 73119
Heronville NeighborhoodEstimated Value: $65,000 - $94,740
2
Beds
1
Bath
920
Sq Ft
$86/Sq Ft
Est. Value
About This Home
This home is located at 1425 SW 35th St, Oklahoma City, OK 73119 and is currently estimated at $79,435, approximately $86 per square foot. 1425 SW 35th St is a home located in Oklahoma County with nearby schools including Coolidge Elementary School, Roosevelt Middle School, and U. S. Grant High School.
Ownership History
Date
Name
Owned For
Owner Type
Purchase Details
Closed on
Aug 8, 2013
Sold by
Acpaco Corp
Bought by
Teneyuca Aurelio and Teneyuca Jessica
Current Estimated Value
Home Financials for this Owner
Home Financials are based on the most recent Mortgage that was taken out on this home.
Original Mortgage
$37,502
Outstanding Balance
$28,000
Interest Rate
4.49%
Mortgage Type
Purchase Money Mortgage
Estimated Equity
$51,435
Purchase Details
Closed on
Jun 13, 2012
Sold by
Oklahoma County
Bought by
Acpaco Corporation
Purchase Details
Closed on
Feb 15, 2005
Sold by
Barnett Kenneth J and Barnett Cheryl L
Bought by
Adr Home Enterprises Inc
Home Financials for this Owner
Home Financials are based on the most recent Mortgage that was taken out on this home.
Original Mortgage
$39,150
Interest Rate
5.82%
Mortgage Type
Stand Alone First
Purchase Details
Closed on
Jun 16, 2003
Sold by
Wright Gary A and Wright Cheryl A
Bought by
Barnett Kenneth and Barnett Cheryl N
Create a Home Valuation Report for This Property
The Home Valuation Report is an in-depth analysis detailing your home's value as well as a comparison with similar homes in the area
Home Values in the Area
Average Home Value in this Area
Purchase History
| Date | Buyer | Sale Price | Title Company |
|---|---|---|---|
| Teneyuca Aurelio | $40,000 | None Available | |
| Acpaco Corporation | $13,400 | None Available | |
| Adr Home Enterprises Inc | -- | Capitol Abstract & Title | |
| Barnett Kenneth J | -- | Capitol Abstract & Title | |
| Barnett Kenneth | $25,000 | American Guaranty Title Co |
Source: Public Records
Mortgage History
| Date | Status | Borrower | Loan Amount |
|---|---|---|---|
| Open | Teneyuca Aurelio | $37,502 | |
| Previous Owner | Barnett Kenneth J | $39,150 |
Source: Public Records
Tax History Compared to Growth
Tax History
| Year | Tax Paid | Tax Assessment Tax Assessment Total Assessment is a certain percentage of the fair market value that is determined by local assessors to be the total taxable value of land and additions on the property. | Land | Improvement |
|---|---|---|---|---|
| 2024 | $746 | $6,618 | $935 | $5,683 |
| 2023 | $746 | $6,303 | $996 | $5,307 |
| 2022 | $676 | $6,002 | $1,011 | $4,991 |
| 2021 | $642 | $5,717 | $836 | $4,881 |
| 2020 | $617 | $5,445 | $900 | $4,545 |
| 2019 | $613 | $5,428 | $871 | $4,557 |
| 2018 | $585 | $5,170 | $0 | $0 |
| 2017 | $479 | $4,234 | $900 | $3,334 |
| 2016 | $479 | $4,234 | $900 | $3,334 |
| 2015 | $515 | $4,506 | $900 | $3,606 |
| 2014 | $491 | $4,317 | $900 | $3,417 |
Source: Public Records
Map
Nearby Homes
- 3900 Rancho Dr
- 1432 Johnston Dr
- 1128 SW Grand Blvd
- 1648 SW 40th St
- 2141 SW 35th St
- 16024 Zamora Ln
- 1141 SW Binkley St
- 1116 SW 38th St
- 3225 S Douglas Ave
- 1536 SW 28th St
- 1328 SW 28th St
- 1544 SW 43rd St
- 2233 SW 40th St
- 1033 SW Binkley St
- 1134 SW 42nd St
- 1521 SW 45th St
- 2304 SW Binkley St
- 3916 S Youngs Place
- 2221 SW 42nd St
- 1545 SW 45th St
- 1421 SW 35th St
- 1429 SW 35th St
- 1417 SW 35th St
- 1431 SW 35th St
- 1424 SW 34th St
- 1420 SW 34th St
- 1428 SW 34th St
- 1437 SW 35th St
- 1413 SW 35th St
- 1416 SW 34th St
- 1432 SW 34th St
- 1426 SW 35th St
- 1420 SW 35th St
- 1428 SW 35th St
- 1412 SW 34th St
- 1436 SW 34th St
- 1441 SW 35th St
- 1409 SW 35th St
- 1416 SW 35th St
- 1432 SW 35th St