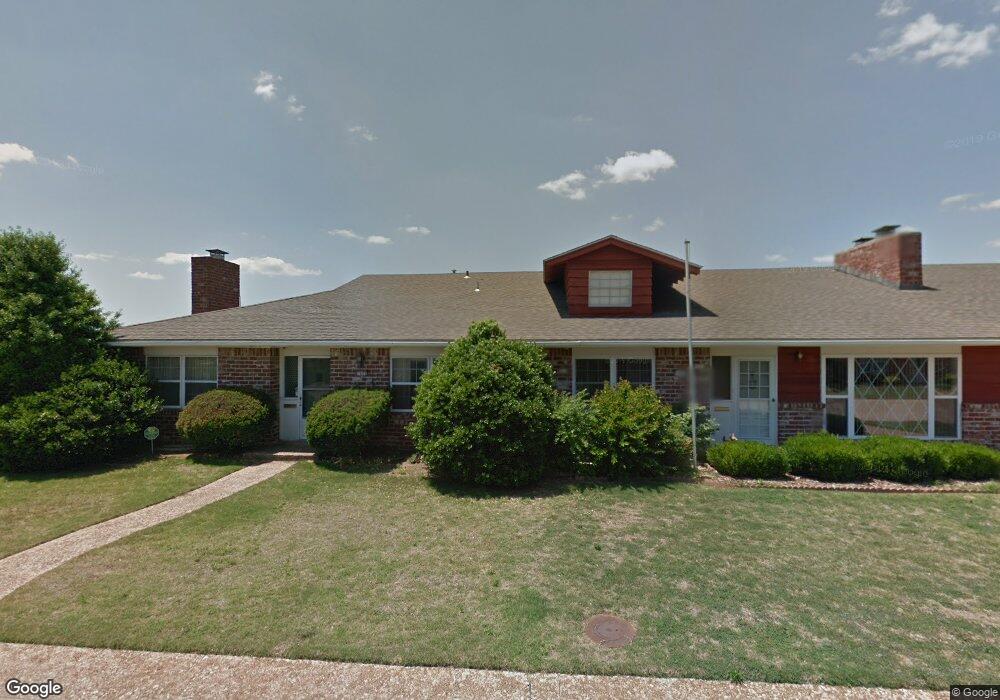
1425 Swan Dr Bartlesville, OK 74006
Estimated Value: $164,000 - $194,000
2
Beds
3
Baths
1,636
Sq Ft
$110/Sq Ft
Est. Value
About This Home
This home is located at 1425 Swan Dr, Bartlesville, OK 74006 and is currently estimated at $180,567, approximately $110 per square foot. 1425 Swan Dr is a home located in Washington County with nearby schools including Ranch Heights Elementary School, Bartlesville High School, and Oklahoma Connections Academy Elementary School.
Ownership History
Date
Name
Owned For
Owner Type
Purchase Details
Closed on
May 24, 2024
Sold by
Hunt David M and Hunt Laura P
Bought by
Bartel Vickey
Current Estimated Value
Home Financials for this Owner
Home Financials are based on the most recent Mortgage that was taken out on this home.
Original Mortgage
$151,050
Outstanding Balance
$149,046
Interest Rate
7.17%
Mortgage Type
New Conventional
Estimated Equity
$31,521
Purchase Details
Closed on
Oct 30, 2018
Sold by
Pidge Shawna and Pidge James
Bought by
Hunt David M and Hunt Laura P
Purchase Details
Closed on
Sep 10, 2015
Sold by
Fletcher Vilda R
Bought by
Fletcher Vilda R and Pidge Shawba
Purchase Details
Closed on
Jun 17, 2014
Sold by
Wilson Delma L Trust
Purchase Details
Closed on
Nov 12, 2001
Sold by
Wilson Delma L
Purchase Details
Closed on
Apr 24, 1996
Sold by
Wilson Clarence C and Wilson Delma L
Create a Home Valuation Report for This Property
The Home Valuation Report is an in-depth analysis detailing your home's value as well as a comparison with similar homes in the area
Home Values in the Area
Average Home Value in this Area
Purchase History
| Date | Buyer | Sale Price | Title Company |
|---|---|---|---|
| Bartel Vickey | $159,000 | First American Title | |
| Hunt David M | $115,000 | First American Title Insuran | |
| Fletcher Vilda R | -- | None Available | |
| -- | $95,000 | -- | |
| -- | -- | -- | |
| -- | -- | -- |
Source: Public Records
Mortgage History
| Date | Status | Borrower | Loan Amount |
|---|---|---|---|
| Open | Bartel Vickey | $151,050 |
Source: Public Records
Tax History Compared to Growth
Tax History
| Year | Tax Paid | Tax Assessment Tax Assessment Total Assessment is a certain percentage of the fair market value that is determined by local assessors to be the total taxable value of land and additions on the property. | Land | Improvement |
|---|---|---|---|---|
| 2024 | $1,763 | $14,684 | $1,350 | $13,334 |
| 2023 | $1,763 | $13,984 | $1,350 | $12,634 |
| 2022 | $1,675 | $13,984 | $1,350 | $12,634 |
| 2021 | $1,626 | $13,845 | $1,350 | $12,495 |
| 2020 | $1,583 | $13,186 | $1,350 | $11,836 |
| 2019 | $1,539 | $12,814 | $1,350 | $11,464 |
| 2018 | $1,082 | $9,053 | $1,350 | $7,703 |
| 2017 | $1,055 | $8,622 | $1,350 | $7,272 |
| 2016 | $990 | $8,622 | $1,350 | $7,272 |
| 2015 | $1,371 | $11,756 | $1,350 | $10,406 |
| 2014 | $924 | $7,953 | $1,417 | $6,536 |
Source: Public Records
Map
Nearby Homes
- 4040 Sheridan Rd
- 0 Ravenwood Ct
- 1412 Meadow Ln
- 1232 Meadow Dr
- 1115 Grandview Rd
- 1435 Lariat Dr
- 1054 Meadow Dr
- 1521 Lariat Dr
- 1528 Smysor Dr
- 1031 SE Greystone Ave
- 1500 Harris Dr
- 3429 Woodland Rd
- 4626 Rolling Meadows Rd
- 4426 Glen Ct
- 1329 Oakdale Dr
- 3321 Woodland Rd
- 1000 Meadow Dr
- 1405 Brookside Pkwy
- 1063 Rolling Meadows Ct
- 4607 Rolling Hills Dr