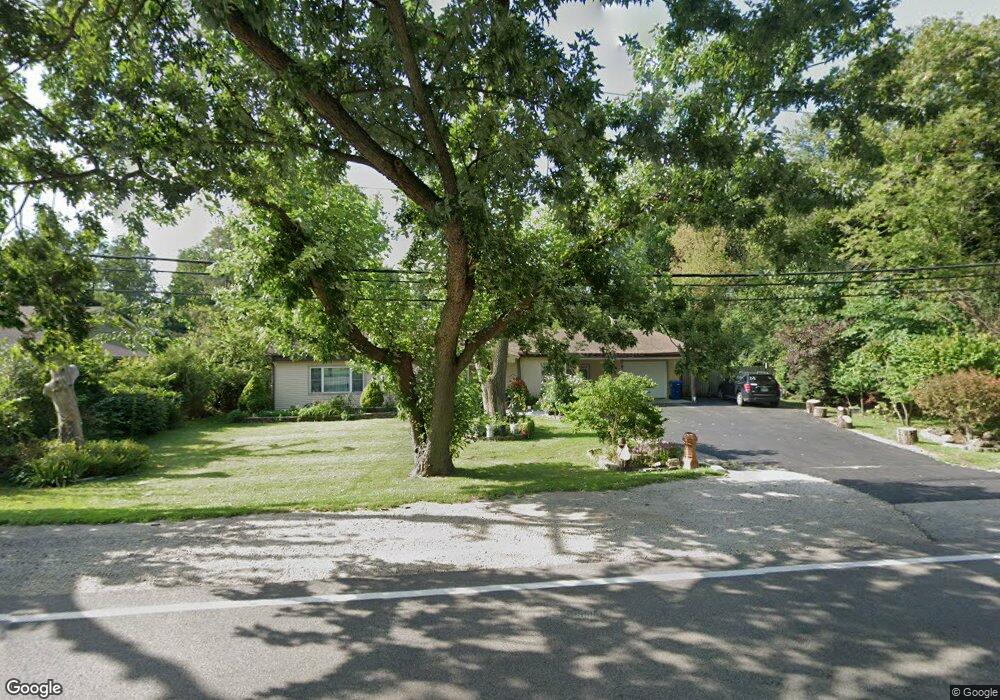
1425 W Yorkhouse Rd Waukegan, IL 60087
Lake County Gardens NeighborhoodEstimated Value: $216,000 - $279,000
2
Beds
1
Bath
1,673
Sq Ft
$143/Sq Ft
Est. Value
About This Home
This home is located at 1425 W Yorkhouse Rd, Waukegan, IL 60087 and is currently estimated at $238,564, approximately $142 per square foot. 1425 W Yorkhouse Rd is a home located in Lake County with nearby schools including H R McCall Elementary School, Jack Benny Middle School, and Waukegan High School.
Ownership History
Date
Name
Owned For
Owner Type
Purchase Details
Closed on
May 10, 2000
Sold by
Castellanos Jesus and Castellanos Edith
Bought by
Aranda Alejandro
Current Estimated Value
Home Financials for this Owner
Home Financials are based on the most recent Mortgage that was taken out on this home.
Original Mortgage
$85,000
Interest Rate
8.26%
Purchase Details
Closed on
Aug 31, 1995
Sold by
Hankins David L
Bought by
Castellanos Jesus and Castellanos Edith
Home Financials for this Owner
Home Financials are based on the most recent Mortgage that was taken out on this home.
Original Mortgage
$80,061
Interest Rate
7.55%
Mortgage Type
FHA
Purchase Details
Closed on
Sep 2, 1993
Sold by
National Bank And Trust Co Of Waukegan
Bought by
Hankins David L
Home Financials for this Owner
Home Financials are based on the most recent Mortgage that was taken out on this home.
Original Mortgage
$50,400
Interest Rate
7.26%
Create a Home Valuation Report for This Property
The Home Valuation Report is an in-depth analysis detailing your home's value as well as a comparison with similar homes in the area
Home Values in the Area
Average Home Value in this Area
Purchase History
| Date | Buyer | Sale Price | Title Company |
|---|---|---|---|
| Aranda Alejandro | $95,000 | First American Title | |
| Castellanos Jesus | $87,000 | Ticor Title Insurance Compan | |
| Hankins David L | $42,000 | -- |
Source: Public Records
Mortgage History
| Date | Status | Borrower | Loan Amount |
|---|---|---|---|
| Closed | Aranda Alejandro | $85,000 | |
| Previous Owner | Castellanos Jesus | $80,061 | |
| Previous Owner | Hankins David L | $50,400 |
Source: Public Records
Tax History Compared to Growth
Tax History
| Year | Tax Paid | Tax Assessment Tax Assessment Total Assessment is a certain percentage of the fair market value that is determined by local assessors to be the total taxable value of land and additions on the property. | Land | Improvement |
|---|---|---|---|---|
| 2024 | $5,363 | $63,524 | $16,066 | $47,458 |
| 2023 | $5,008 | $56,873 | $14,384 | $42,489 |
| 2022 | $5,008 | $51,230 | $11,500 | $39,730 |
| 2021 | $4,427 | $42,464 | $9,359 | $33,105 |
| 2020 | $4,484 | $39,560 | $8,719 | $30,841 |
| 2019 | $4,516 | $36,251 | $7,990 | $28,261 |
| 2018 | $5,385 | $41,631 | $8,077 | $33,554 |
| 2017 | $5,242 | $36,832 | $7,146 | $29,686 |
| 2016 | $4,949 | $32,006 | $6,210 | $25,796 |
| 2015 | $4,839 | $28,646 | $5,558 | $23,088 |
| 2014 | $4,428 | $31,711 | $4,563 | $27,148 |
| 2012 | $5,708 | $34,356 | $4,944 | $29,412 |
Source: Public Records
Map
Nearby Homes
- 1636 Rice St
- 37966 N Cornell Rd
- 37905 N Loyola Ave
- 3411 N Lewis Ave
- 38127 N Shore Ave
- 3211 Rugby Ct
- 38362 N Manor Ave
- 1612 Whitney St
- 2613 N Lewis Ave
- 1730 W Beach Rd
- 3101 Country Club Ln
- 10241 W Bairstow Ave
- 38697 N Cedar Ave
- 2350 N Lewis Ave
- 301 W Eagle Ct
- 0 Traditions Dr
- 2232 Walnut St
- 11345 W Carnahan Ave
- 12312 W Audrey Ave
- 2708 Dana Ave
- 1423 W Yorkhouse Rd
- 1410 Macarthur Dr
- 1428 W Yorkhouse Rd
- 1521 W Yorkhouse Rd
- 1520 W Yorkhouse Rd
- Lot 8 E York House Rd
- 1420 Macarthur Dr
- 1531 W Yorkhouse Rd
- 37783 N De Woody Rd
- 11112 W Yorkhouse Rd
- 1520 Macarthur Dr
- 11112 W York House Rd
- 1533 W Yorkhouse Rd
- 1510 Macarthur Dr
- 1325 W Yorkhouse Rd
- 1408 Macarthur Dr
- 1514 Macarthur Dr
- 3232 N De Woody Rd
- 1314 W Yorkhouse Rd
- 1404 Macarthur Dr